Sankey Time Machine
• Herbert WolversonThe Sankey display in LibreQoS is one of our favorite features (the “Tree Overview” in LibreQoS) - and is often found on NOC walls! It’s a great way to visualize network traffic across your network:
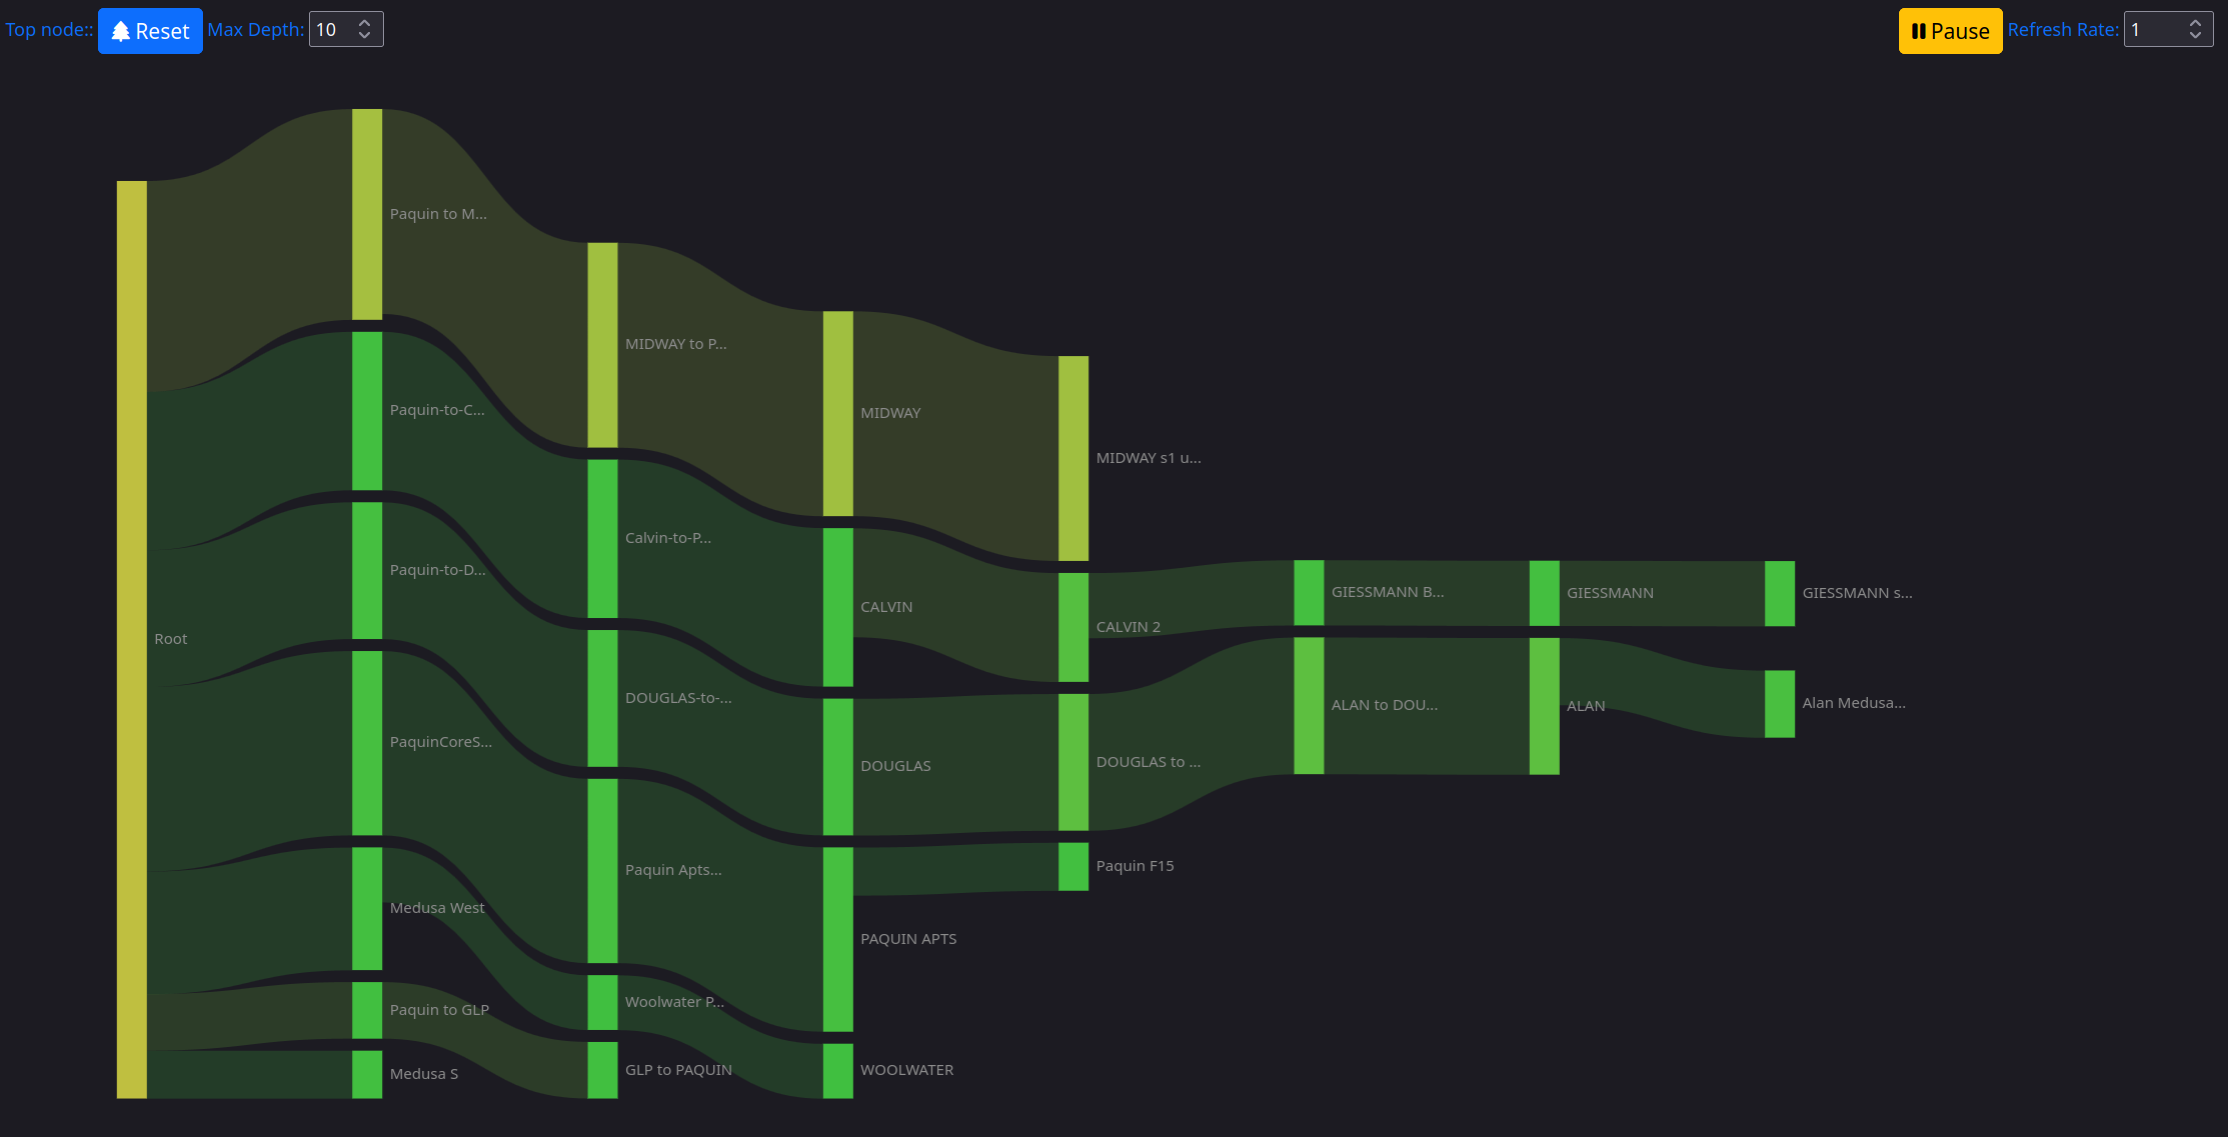
It updates in real-time, showing you where the traffic on your network is going. It changes color to represent saturation, TCP retransmisions or round-trip time.
But: it’s only real-time.
LibreQoS Insight is all about historical data, and empowering you to see what happened. Identifying incidents, understanding trends, and making decisions based on data. So, we asked ourselves: what if the Sankey display had a time machine?
We already have the data: time series data covering the whole network. So we glued together the LibreQoS Sankey display with the Insight time-series data, added time controls, and now you can see the Sankey display for any time in the past. The only difference is that it displays total traffic for that time, rather than current traffic. It still colors the traffic based on saturation, retransmissions and round-trip time, so you can see how the network was performing at that time.
We’re getting there!
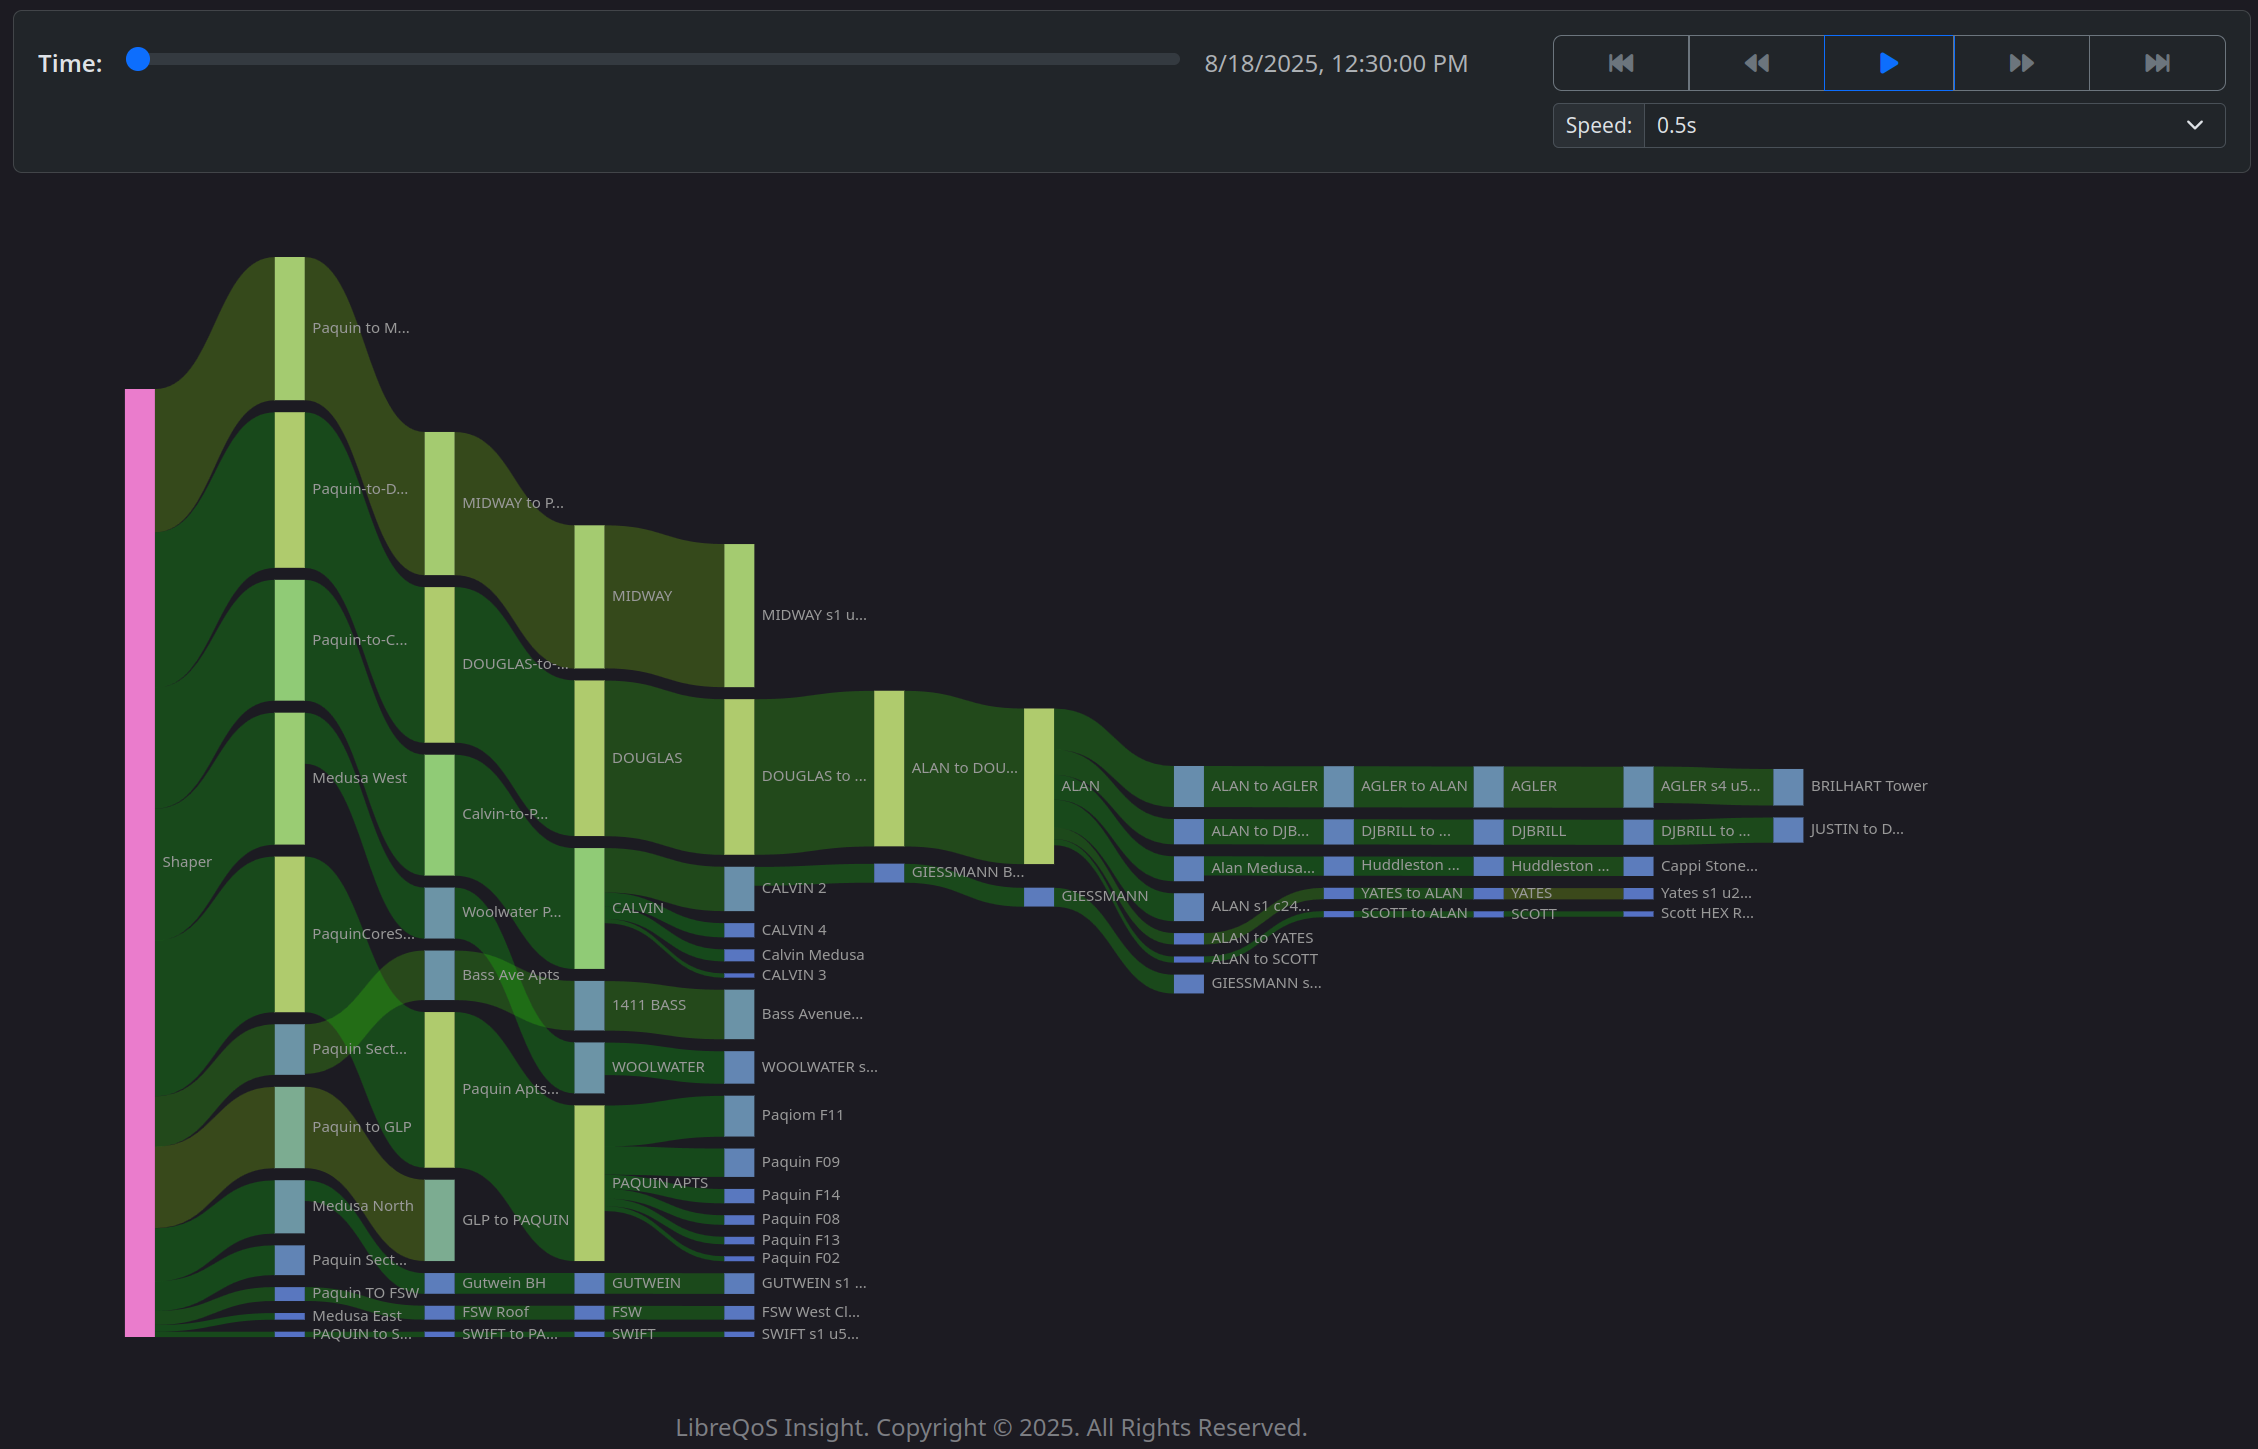
That’s honestly pretty cool - but we didn’t want to stop there. We made sure you could click on any sankey node to see that node. And then we realized - this could replay as a video! So we added a play button, speed controls, and “scrub” controls to the Sankey display. Now you can zero-in on problems — even problems you didn’t know you had! It’s also a mesmerizing screen saver.