The Insight API: Part 1
• Herbert WolversonWe just launched version 0 (Alpha) of the Insight API. LibreQoS shapers have an API, too — and that’ll be the topic of future posts. This one is all about the Insight API.
Pre-Requisites
In order to use the Insight API, you need:
- LibreQoS 1.5 RC2 or later installed on one or more shapers.
- An active Insight account, to which LibreQoS is reporting data.
Accessing The API
The Insight API is a REST-like API, accessible via HTTPS. Full Swagger documentation can be found here: https://insight-api.libreqos.com/api-docs/.
The endpoints at the time of writing are:
GET /health- Check the health of the API.POST /shaper_stats- Retrieve statistics for a given shaper.POST /site_stats- Retrieve statistics for a given site.POST /circuit_stats- Retrieve statistics for a given circuit.
Each of these has a Request type (JSON) and a Response type (JSON).
If you’ve worked with RESTful APIs before, this should all look very familiar - and you’re pretty much ready to go!
Authentication
Every request to the Insight API must be authenticated using your Insight key. You can find this in your /etc/lqos.conf file in [long_term_stats] under the license_key field - or on the LibreQoS User Interface in Configutration -> LibreQoS Insight.
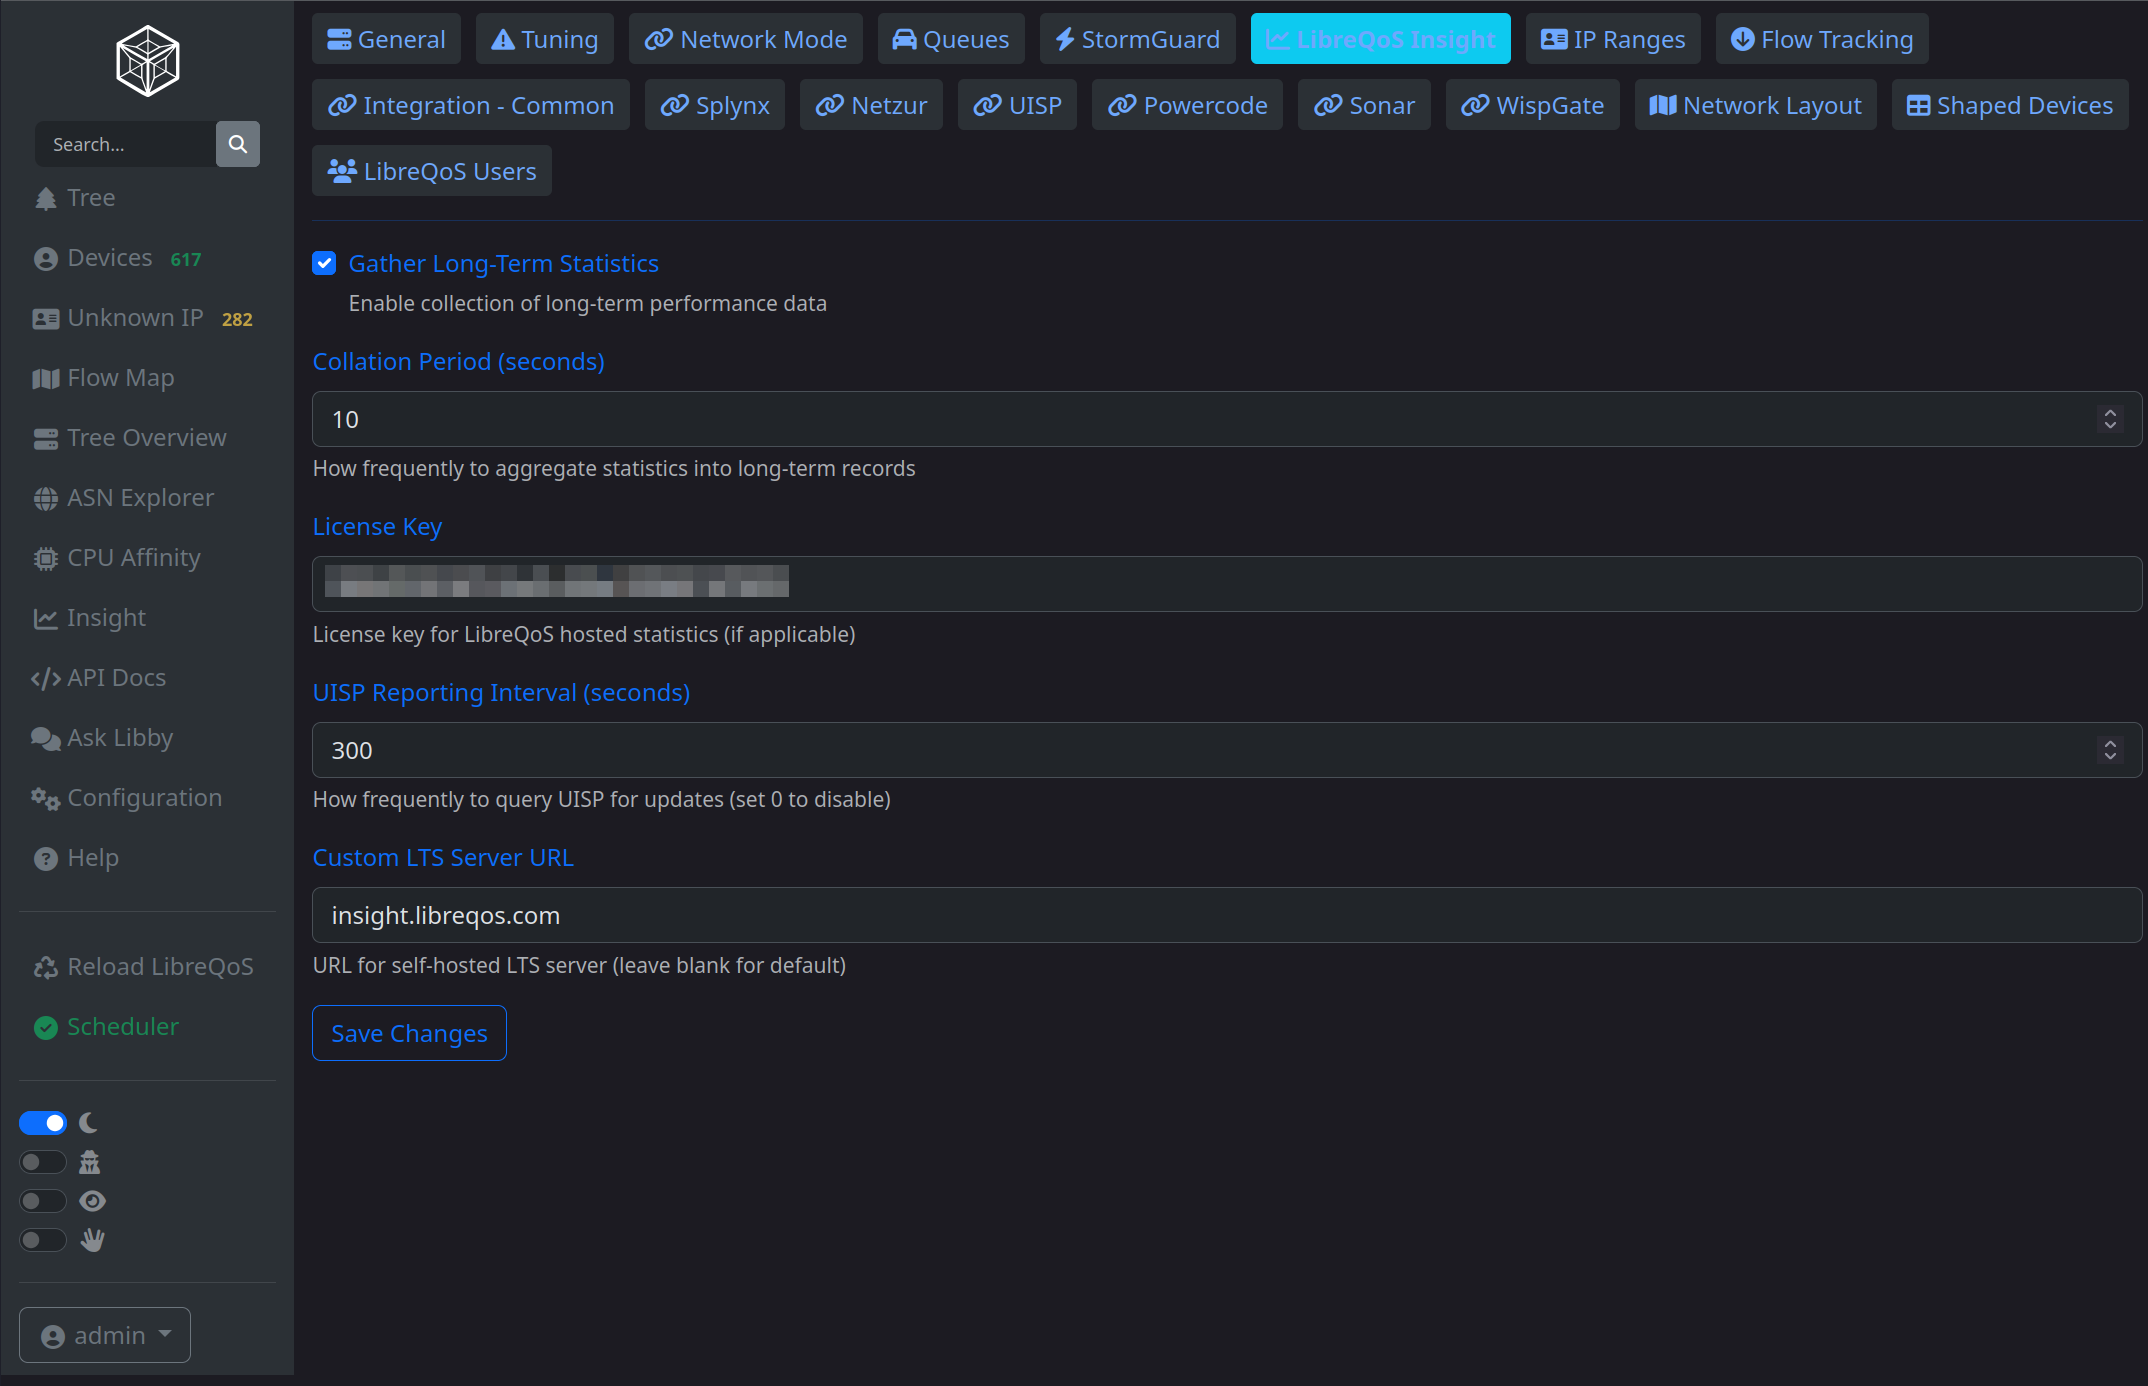
Once you have this key, you need to include in the x-bearer header of every request.
Shaper Node IDs
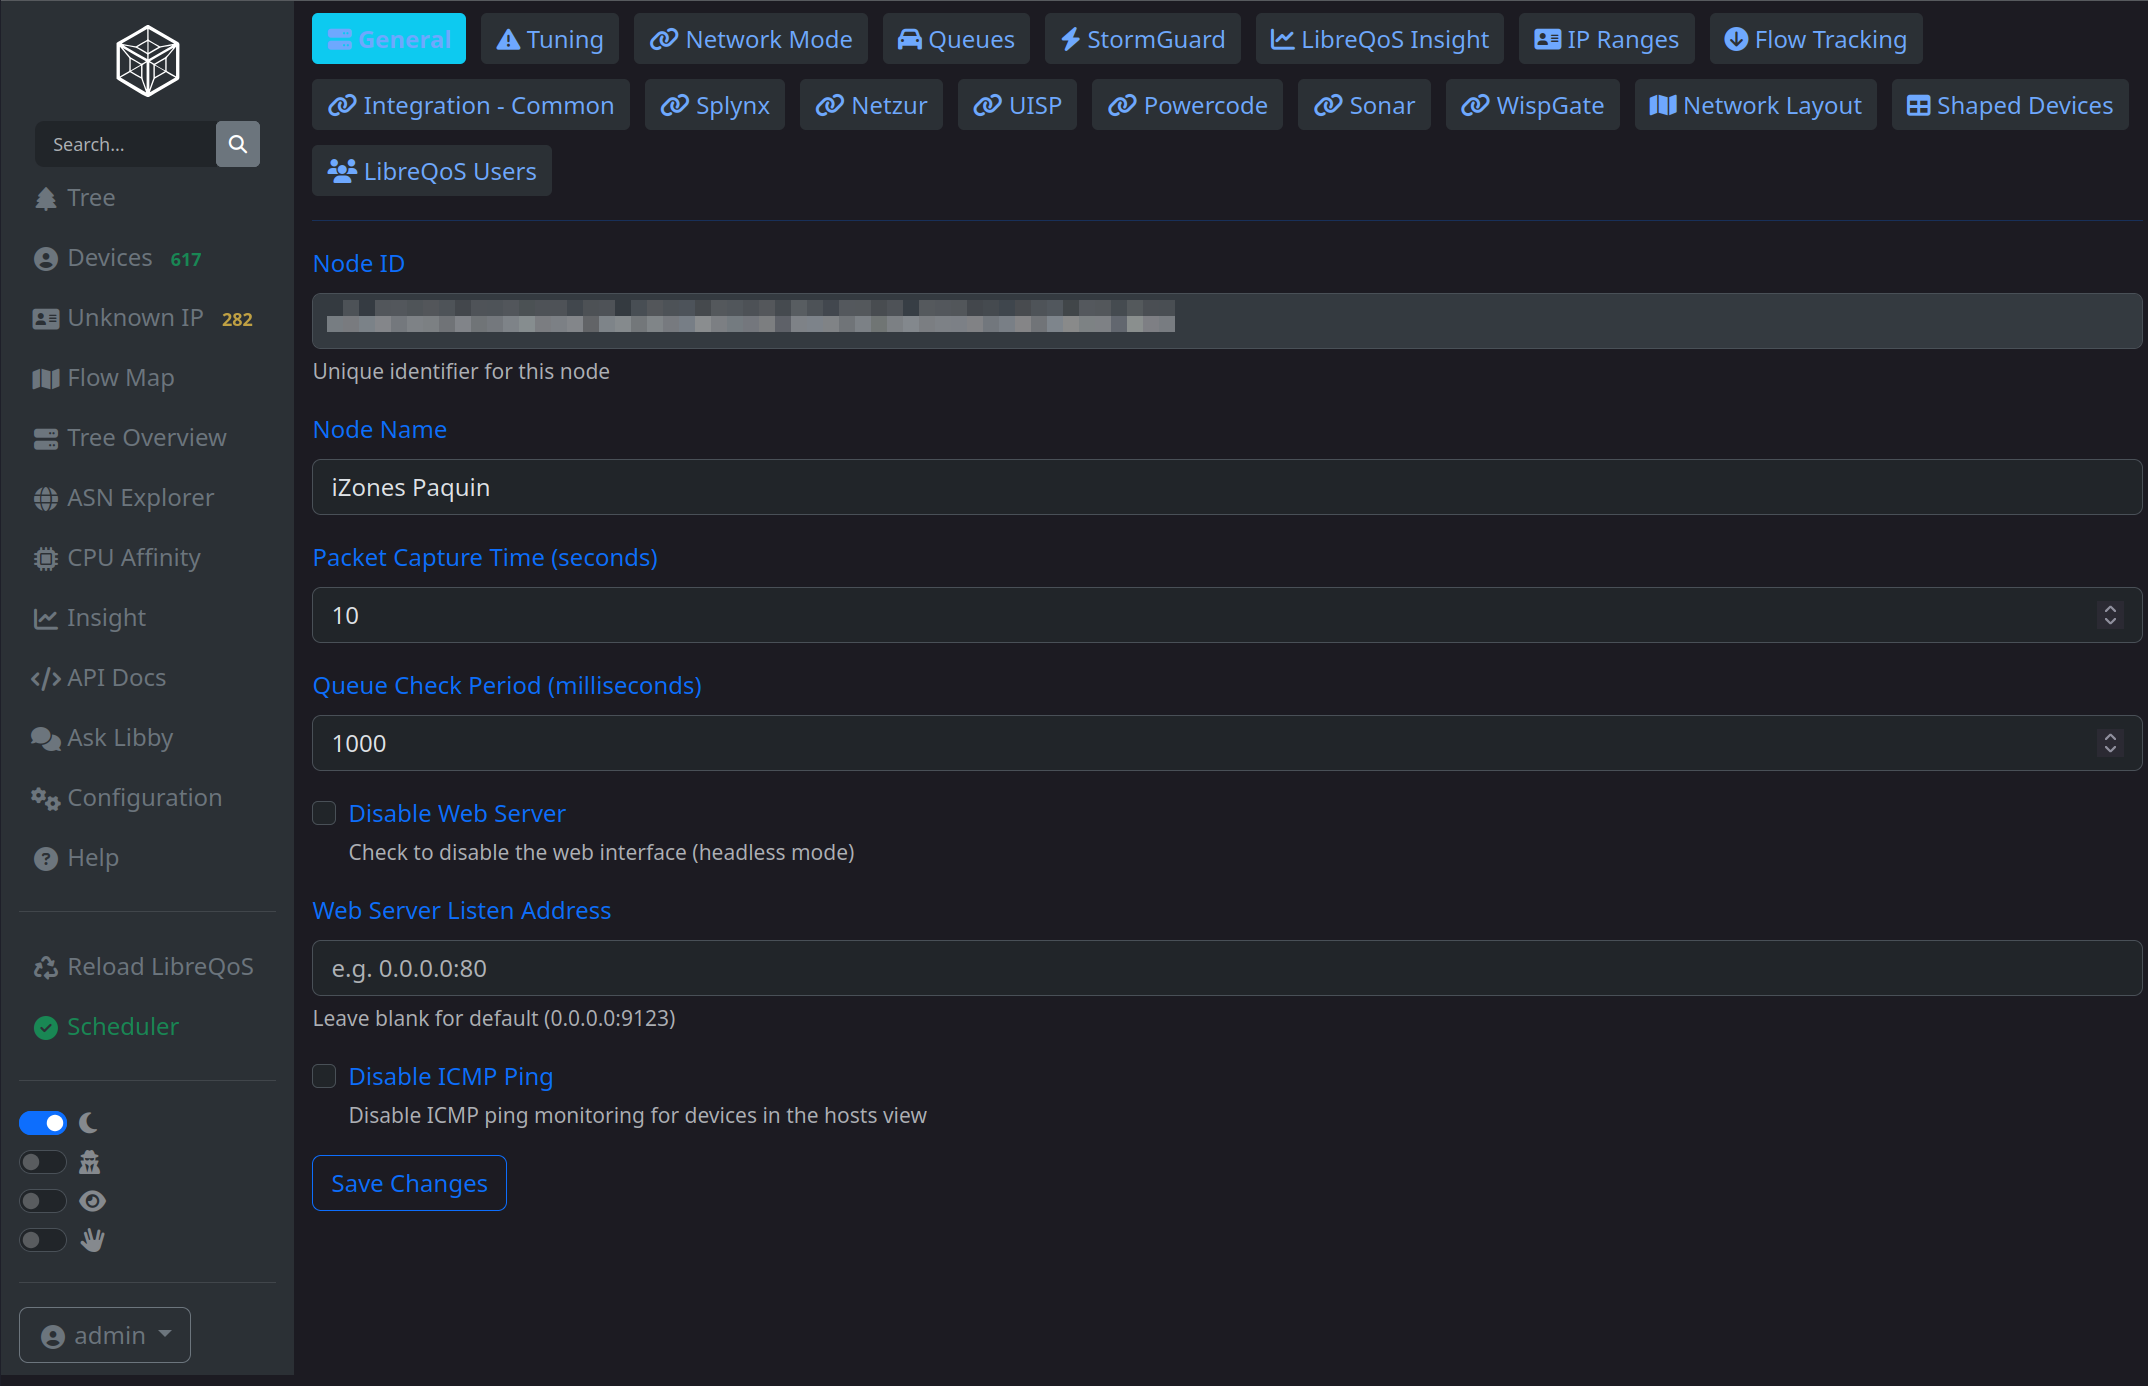
You will also need to know the node_id of your shaper(s). You can get this from the top of /etc/lqos.conf as node_id = "<your id>", or from the LibreQoS User Interface in Configuration -> General.
Making Your First Request
The easiest way to test the API is to open the API docs ( https://insight-api.libreqos.com/api-docs/ ) in your browser. Click the /health endpoint and click “Try it Out”:
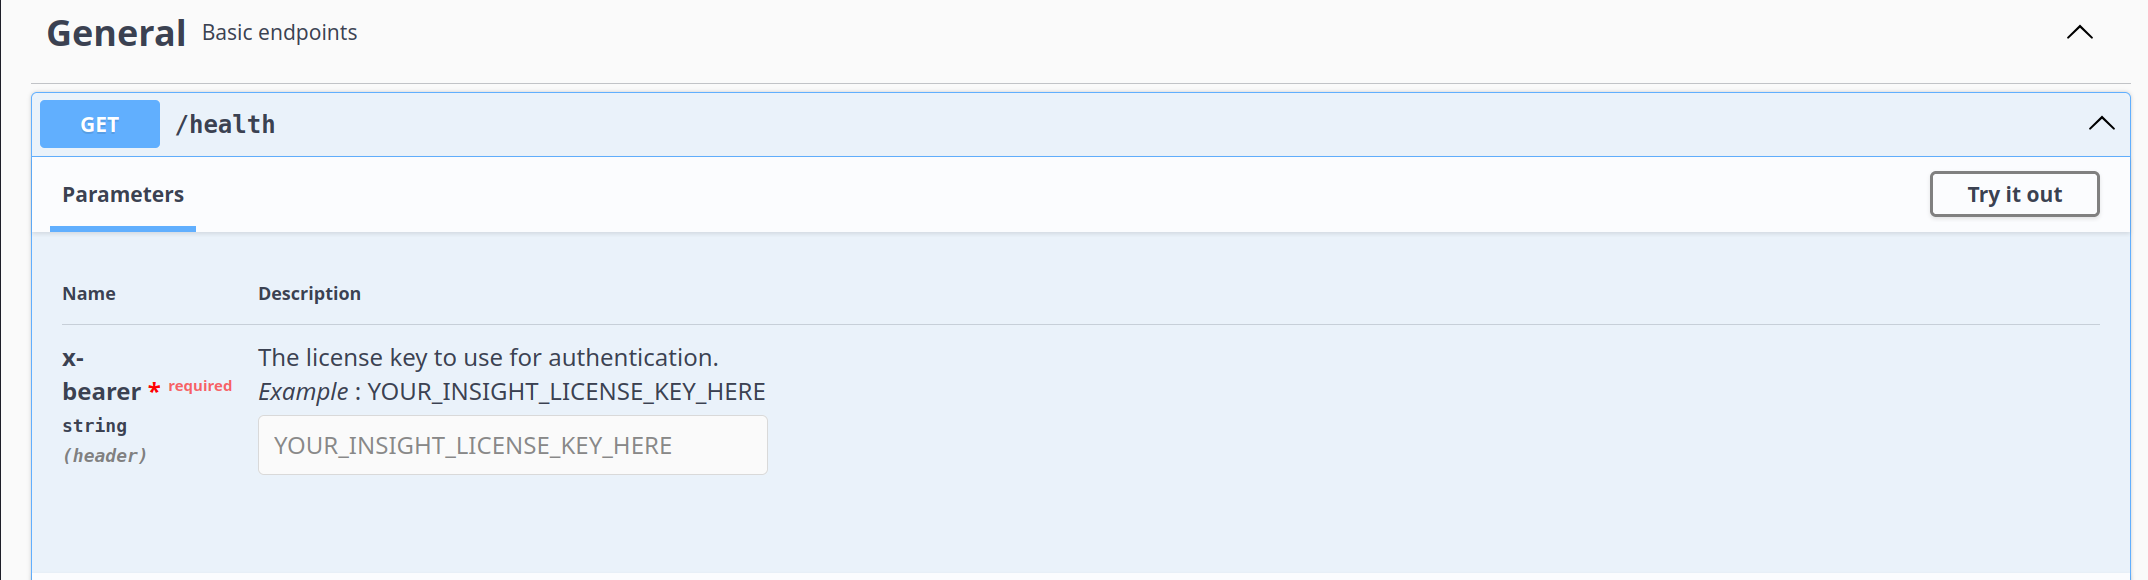
Paste your license key into the x-bearer field, then click “Execute”. You should see a 200 response with a simple JSON body:
{
  "status": "ok"
}
Congratulations! You’ve just made your first Insight API request.
Requesting Shaper Throughput
It’s pretty much impossible to guess what language you’d like to use, so I went with Python in a Jupyter Notebook. Data scientists spend a lot of time in Jupyter Notebooks—it’s a great way to explore data.
For Step 1, I import some libraries:
import time
import requests
import matplotlib.pyplot as plt
time gives me UNIX timestamps (seconds since the epoch). requests is a great HTTP library for Python, and matplotlib is a plotting library.
For Step 2, I setup some variables:
NODE_ID="my_node_id"
LICENSE_KEY="my_license_key"
Then, I define the time period I want to query:
START_TIME = int(time.time() - 60*60)
END_TIME = int(time.time())
So I’m starting one hour ago, and ending now.
For Step 3, I create the request body and header:
request = {
    "shaper_node" : NODE_ID,
    "num_entries": 200, # How many data points to return
    "start_unix": START_TIME,
    "end_unix": END_TIME
}
headers = {"x-bearer": LICENSE_KEY}
Then I make the request:
response = requests.post("https://insight-api.libreqos.com/shaper_stats", json=request, headers=headers)
data = response.json()
Finally, we can extract the throughput data and plot it:
# Extract the data for plotting
ticks = data['ticks']
bytes_down = data['bytes_per_second_down_median']
# Create the plot
plt.figure(figsize=(10, 6))
plt.plot(ticks, bytes_down)
plt.xlabel('Ticks')
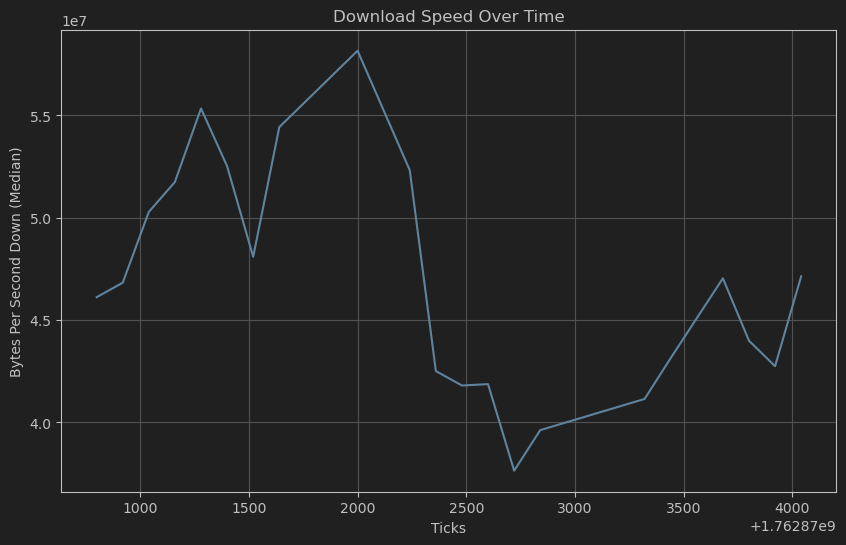
plt.ylabel('Bytes Per Second Down (Median)')
plt.title('Download Speed Over Time')
plt.grid(True)
plt.show()
This gives me a nice graph of download speed over the last hour:
What’s Next?
We’ll work on adding more endpoints and features to the API over time. For now, the ball is in your court. You’ve got the data—go build something awesome with it!
- You could embed circuit data into a customer-facing portal.
- You could integrate with
n8nor other low-code tools to automate reporting or setup event triggers. - You could dump the data into your own dashboarding solution.
The possibilities are endless. Happy coding!