WISP Planner Overview
• Herbert WolversonWe recently launched WISP Planner. In this blog post, I’d like to tell you about it, and what makes it special.
Background
Years ago, I created a site named wisptools.net. No, I’m not going to link to it - because somehow, it’s been purchased by a Russian adult-content company (no, I have no idea why, either). I had the idea for the site because I’d been visiting WISPAmerica in St. Louis, and discovered that the majority of WISP owners weren’t really doing any automated coverage; others were using Radio Mobile, Splat or TowerCoverage. Those are all fine solutions, but they didn’t scratch my itch.
WispTools was pretty advanced for the time. SRTM and LCOV coverage of most of the planet, including higher-resolution coverage of the USA, parts of Canada and some parts of Europe. It generated nice splat maps, decent KMZ exports, and saved us some failed truck rolls. For various reasons, that site didn’t work out in the long term.
When Dave approached me to work on LibreQoS, I was planning on creating Wisp Planner. LibreQoS was really cool, so I dropped my plans. I did take the time to opensource RF Signals - it has enough building blocks that you could build a lidar-based RF analysis system. Unfortunately, when I announced it, the only feedback was “this looks hard”.
Now that LibreQoS is stable and in use around the world, I found myself working from home (due to my wife being injured). And thus, Wisp Planner was born.
Foundation: You Need Great Maps
SRTM is great, and newer sources like ALOS3D and Copernicus can get you pretty good coverage of the planet. The real magic lies in LiDAR and LiDAR-derived data sources. These can be absurdly detailed, 25cm or 50cm coverage are possible in many areas. There’s an unfortunate coverage gap - some areas have amazing LiDAR, some have none at all. And sadly, the Global South - where it is most needed - has the worst data.
A design goal from the start was to automate data collection (and make it easy to add catalogues as we find them, or people tell us about them). Thanks to a vibrant GIS community, there’s a lot of data out there. We’re just getting started, but we have a decent coverage map emerging:
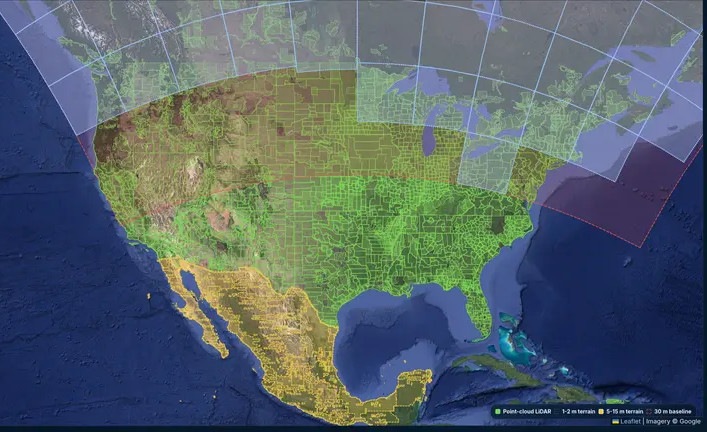
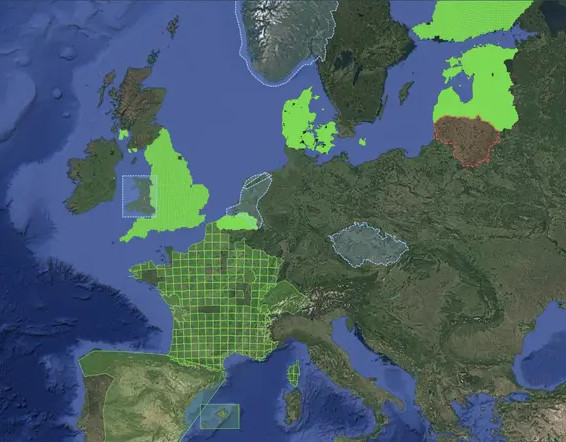
We’re adding more as fast as I can find them!
A common criticism of LiDAR maps is that they tend to produce walls for powerlines, because most surface extraction samples only the top. We don’t do that: we use outlier detection and density estimation, to try and only record the top-most point when it’s really there. We also combine samples between multiple data sources when building our map tiles.
Foundation: WISPs Rule the Rooftops
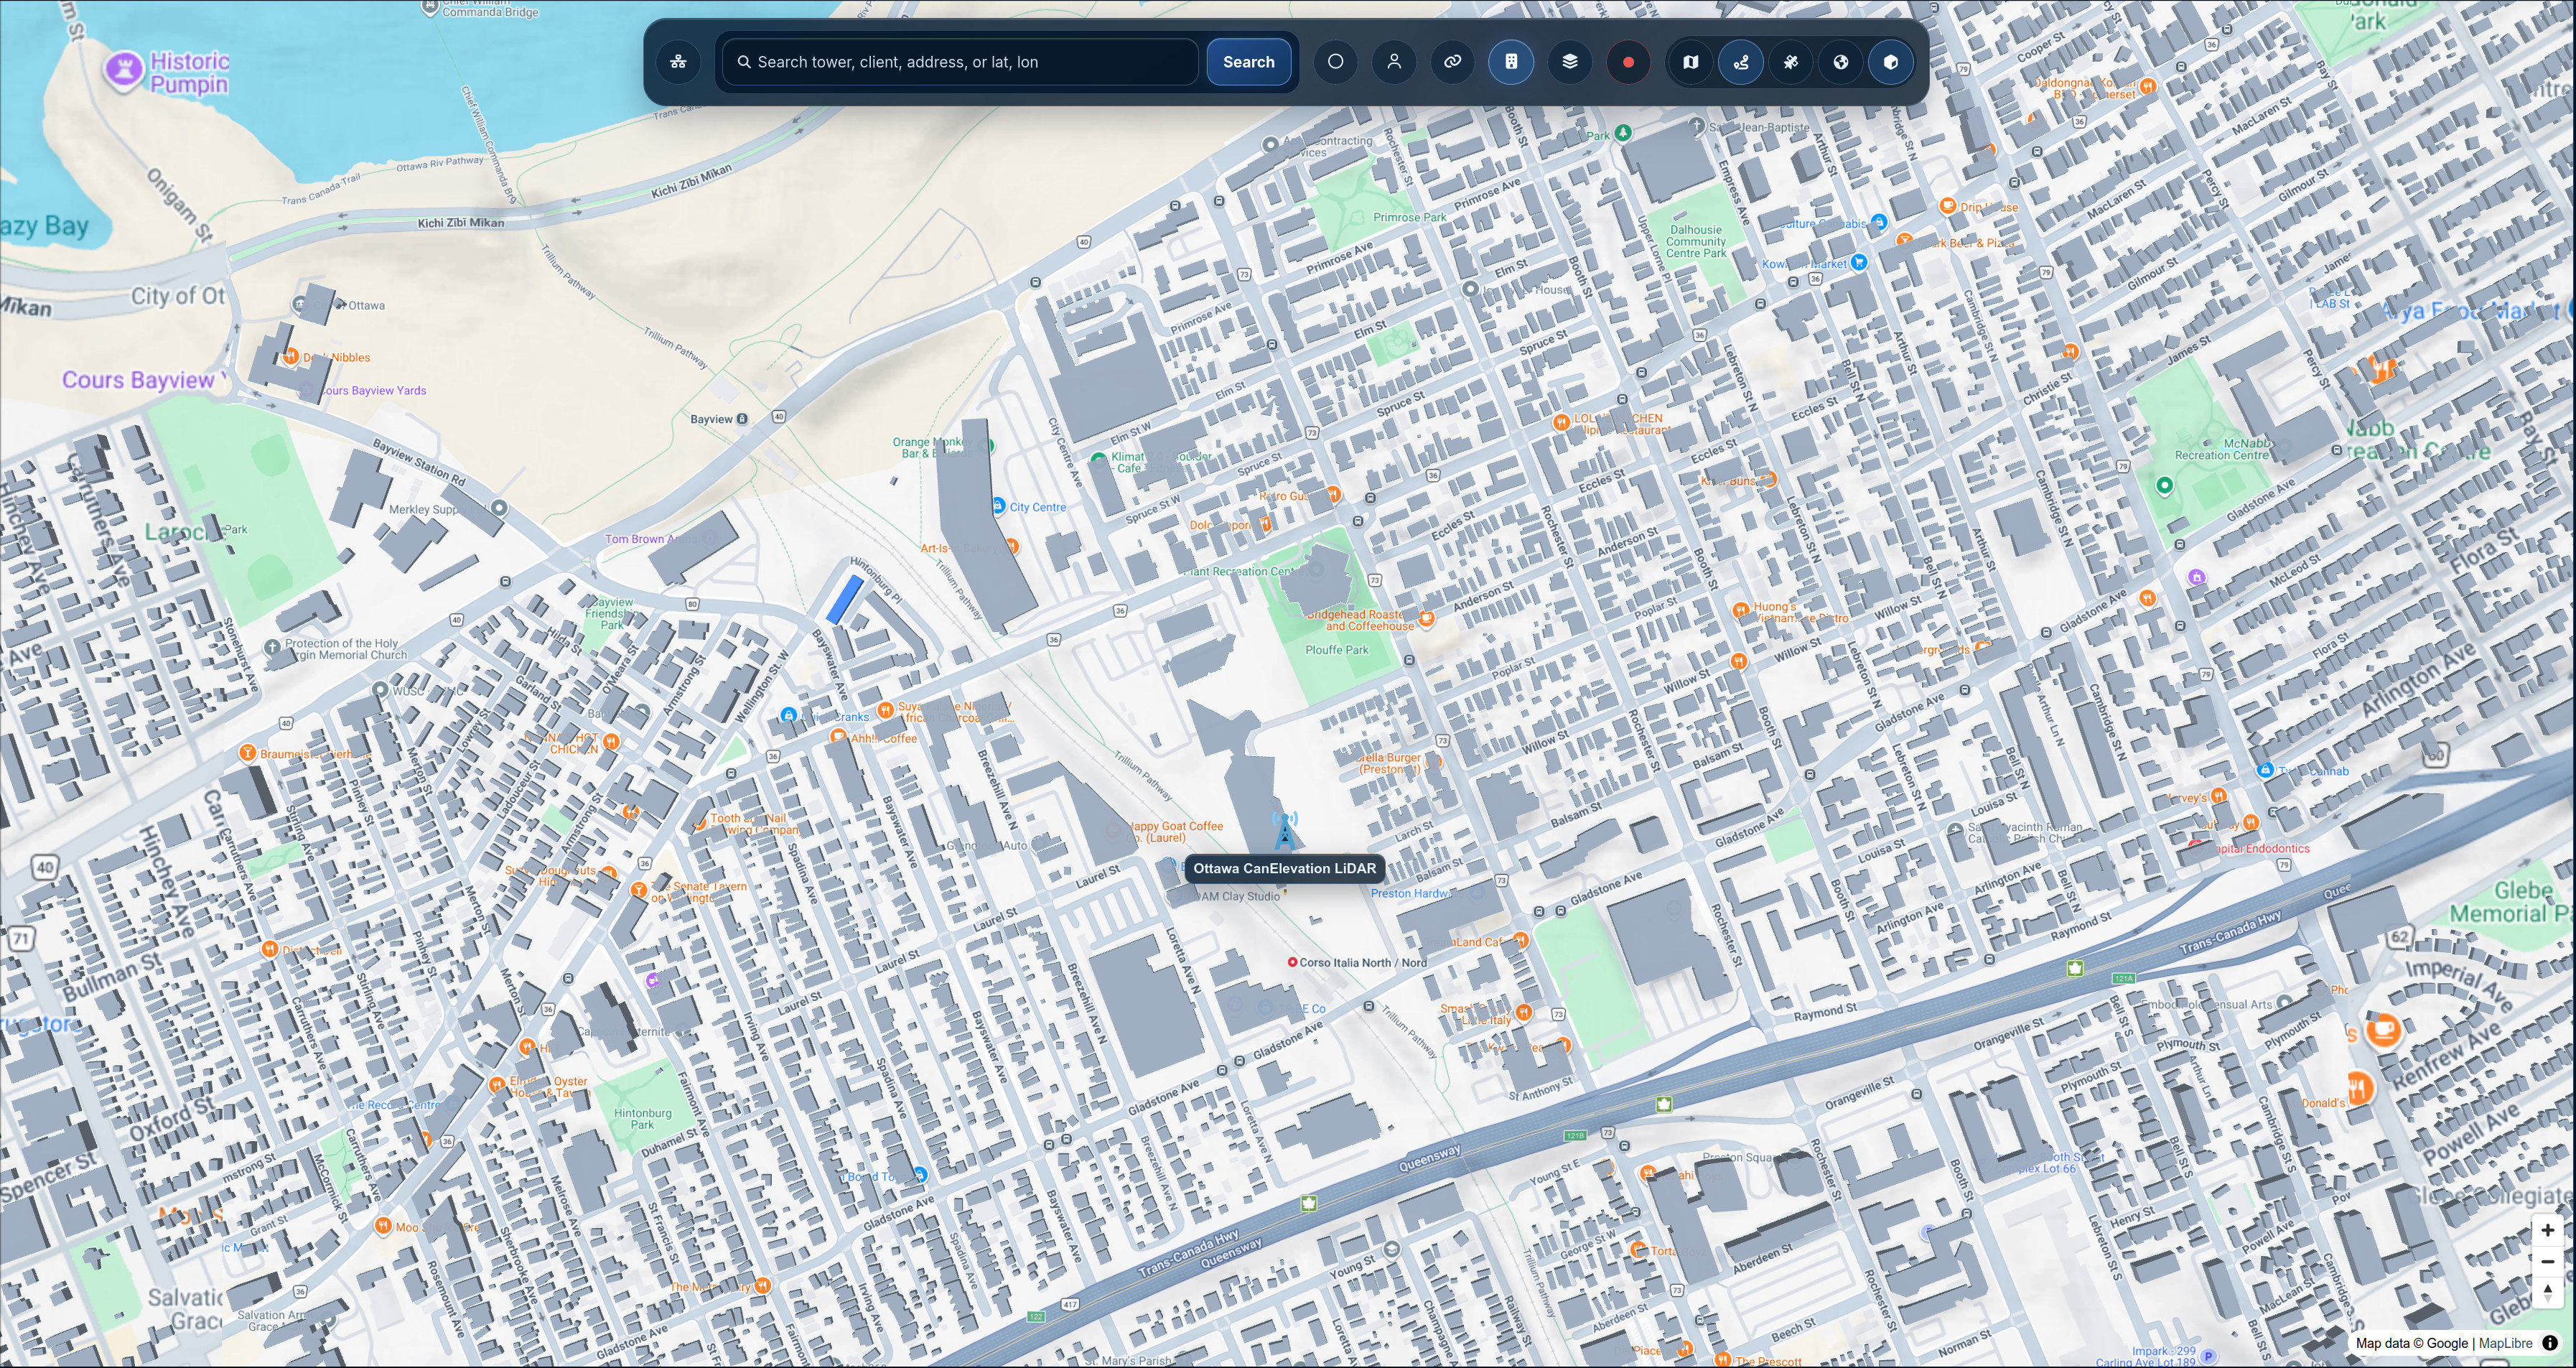
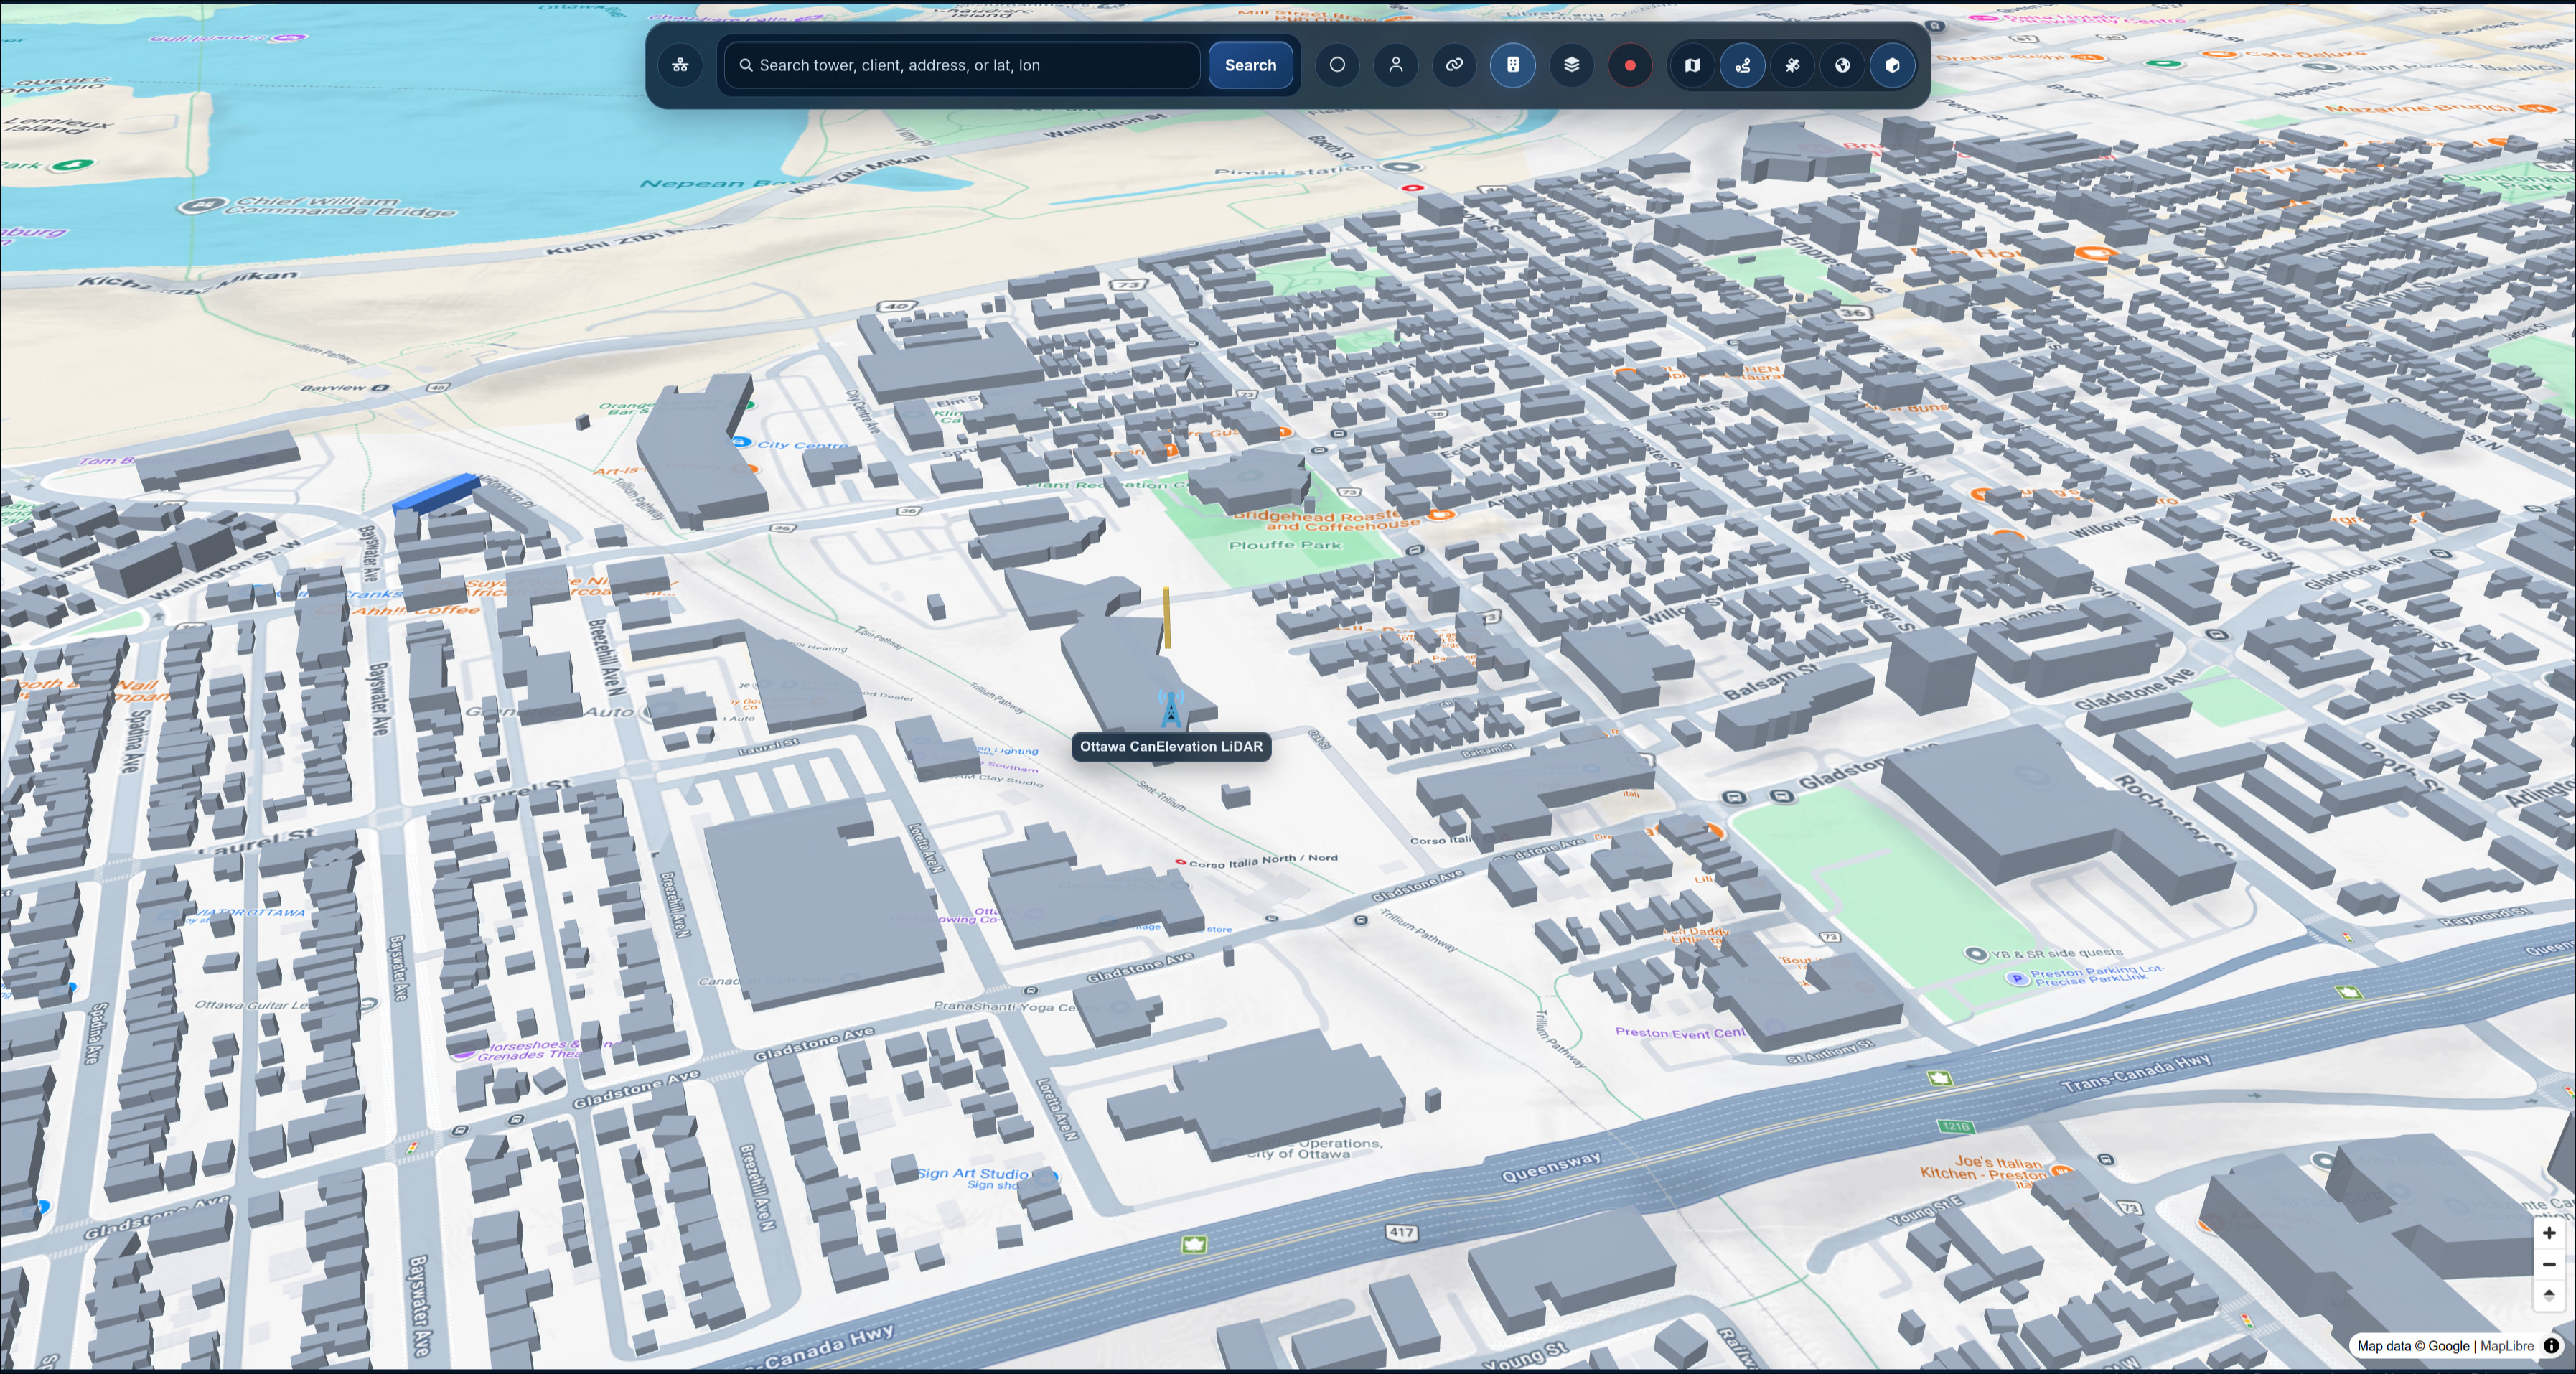
Wireless Internet Service Providers really do have a chosen domain: the rooftop. We install on rooftops, climb buildings, mount things in crazy places. It’s half the fun! So I located several sources of building data, and fused them. During tile creation, we perform sensor fusion to look at the LiDAR, building sources and some algorithms for detecting anomalies. Then we put it together on the map. We use Map Libre to allow you to treat a regular map like Google Earth (and you can turn the buildings, the 3D off if you want to):
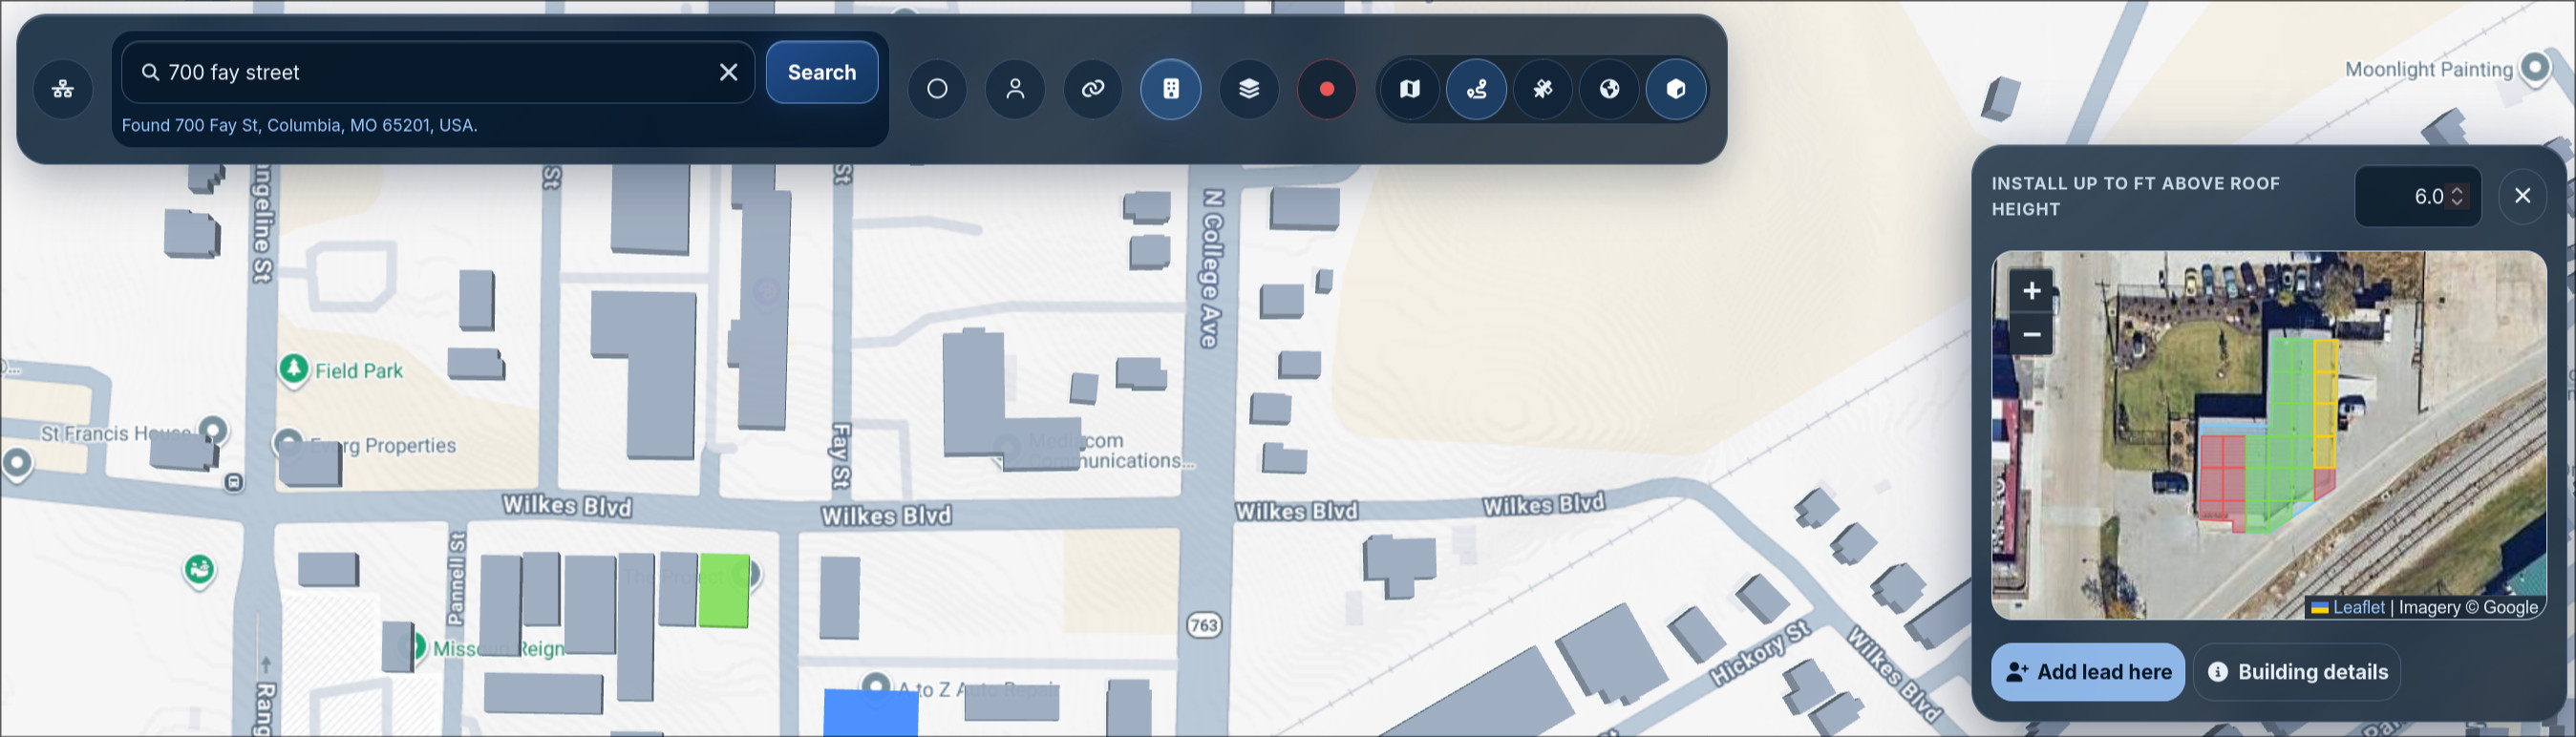
But what you really want to know as a WISP is “can I get service to this customer?”. So we made sure you could search for an address at any time, and click the building to reveal an analysis of the whole rooftop:
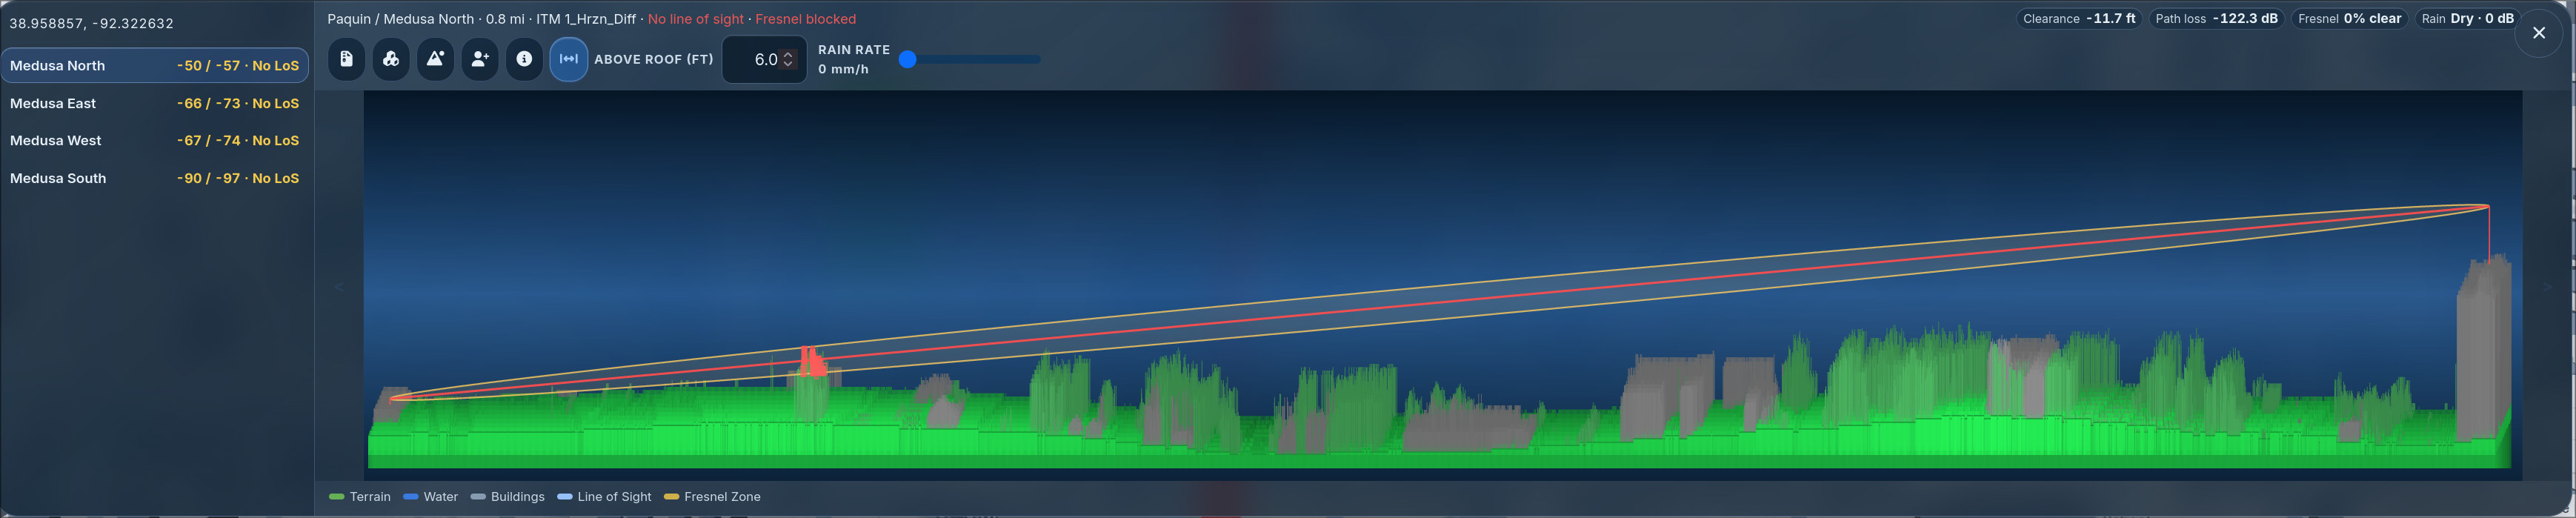
Click any tile in the building (or any point on the map), and you get a detailed (0.5m) path profile showing you the fresnel zone, full RF calculations and availability. Obstructions are clearly highlighted:
Tower Placement
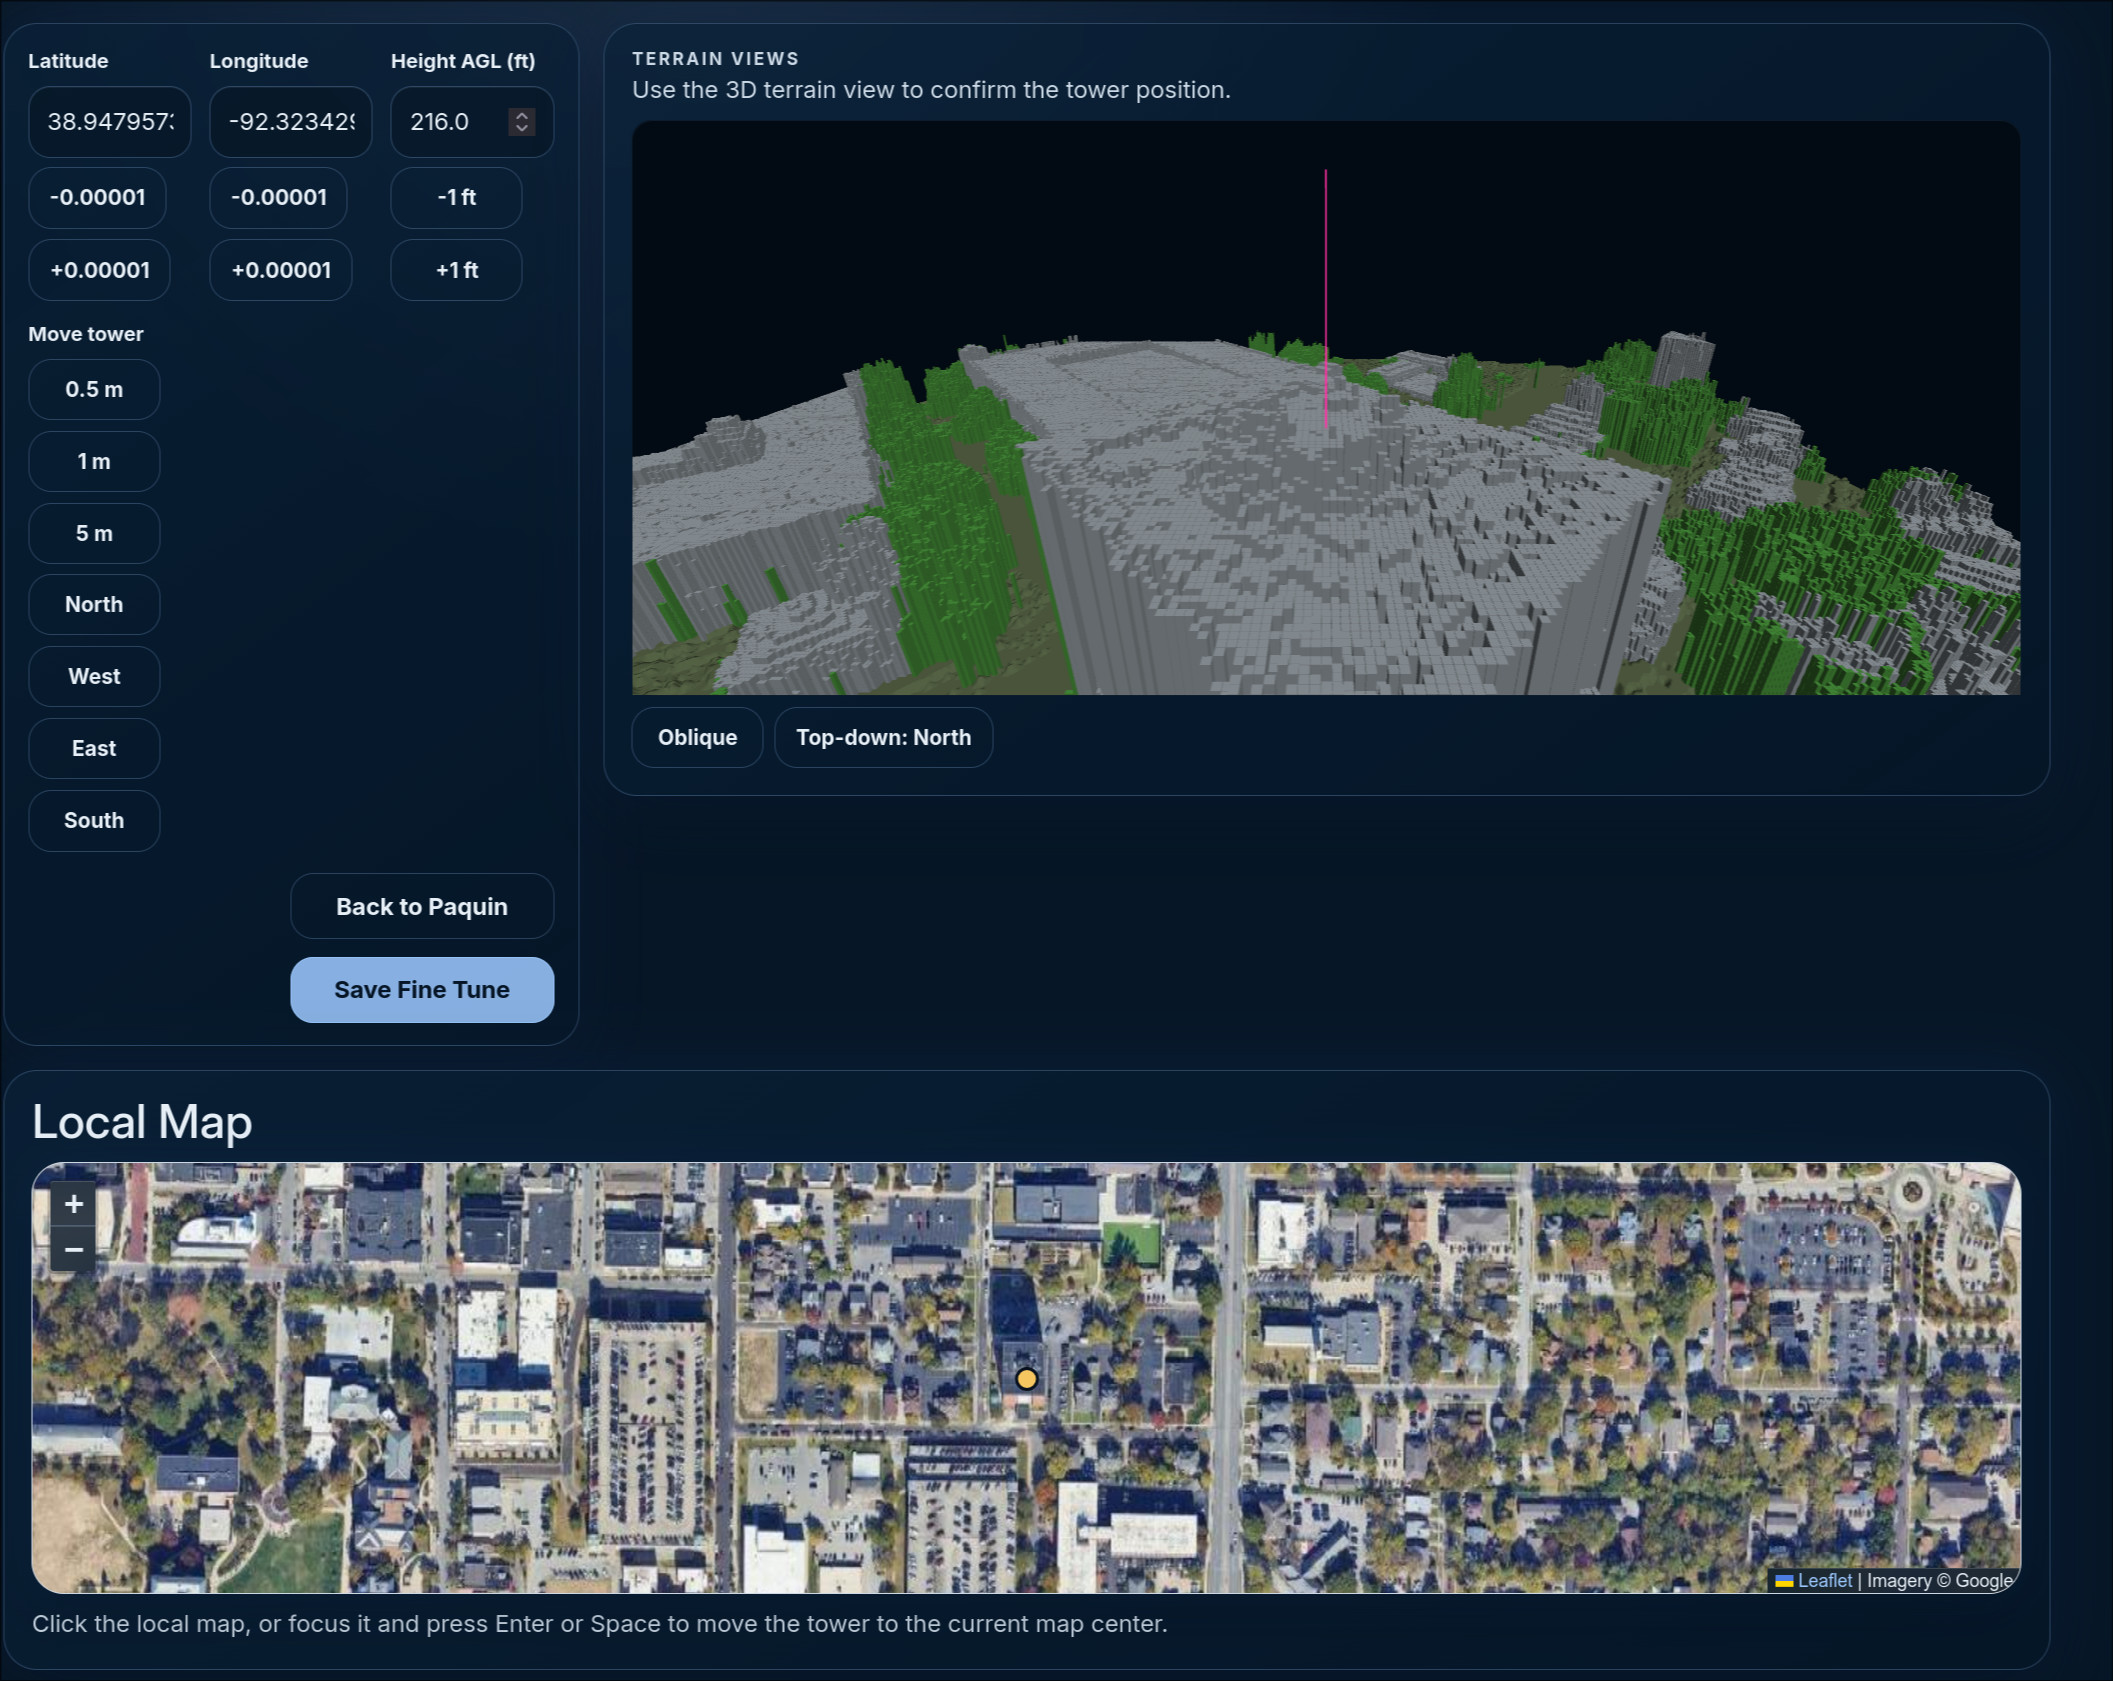
A failure mode that has driven me crazy with some RF planners is tower placement. You paste in coordinates that are nearly on your tower, and the terrain model helpfully skews your results because it’s not quite right. So our tower editor includes a fine-tune system:
RF Math
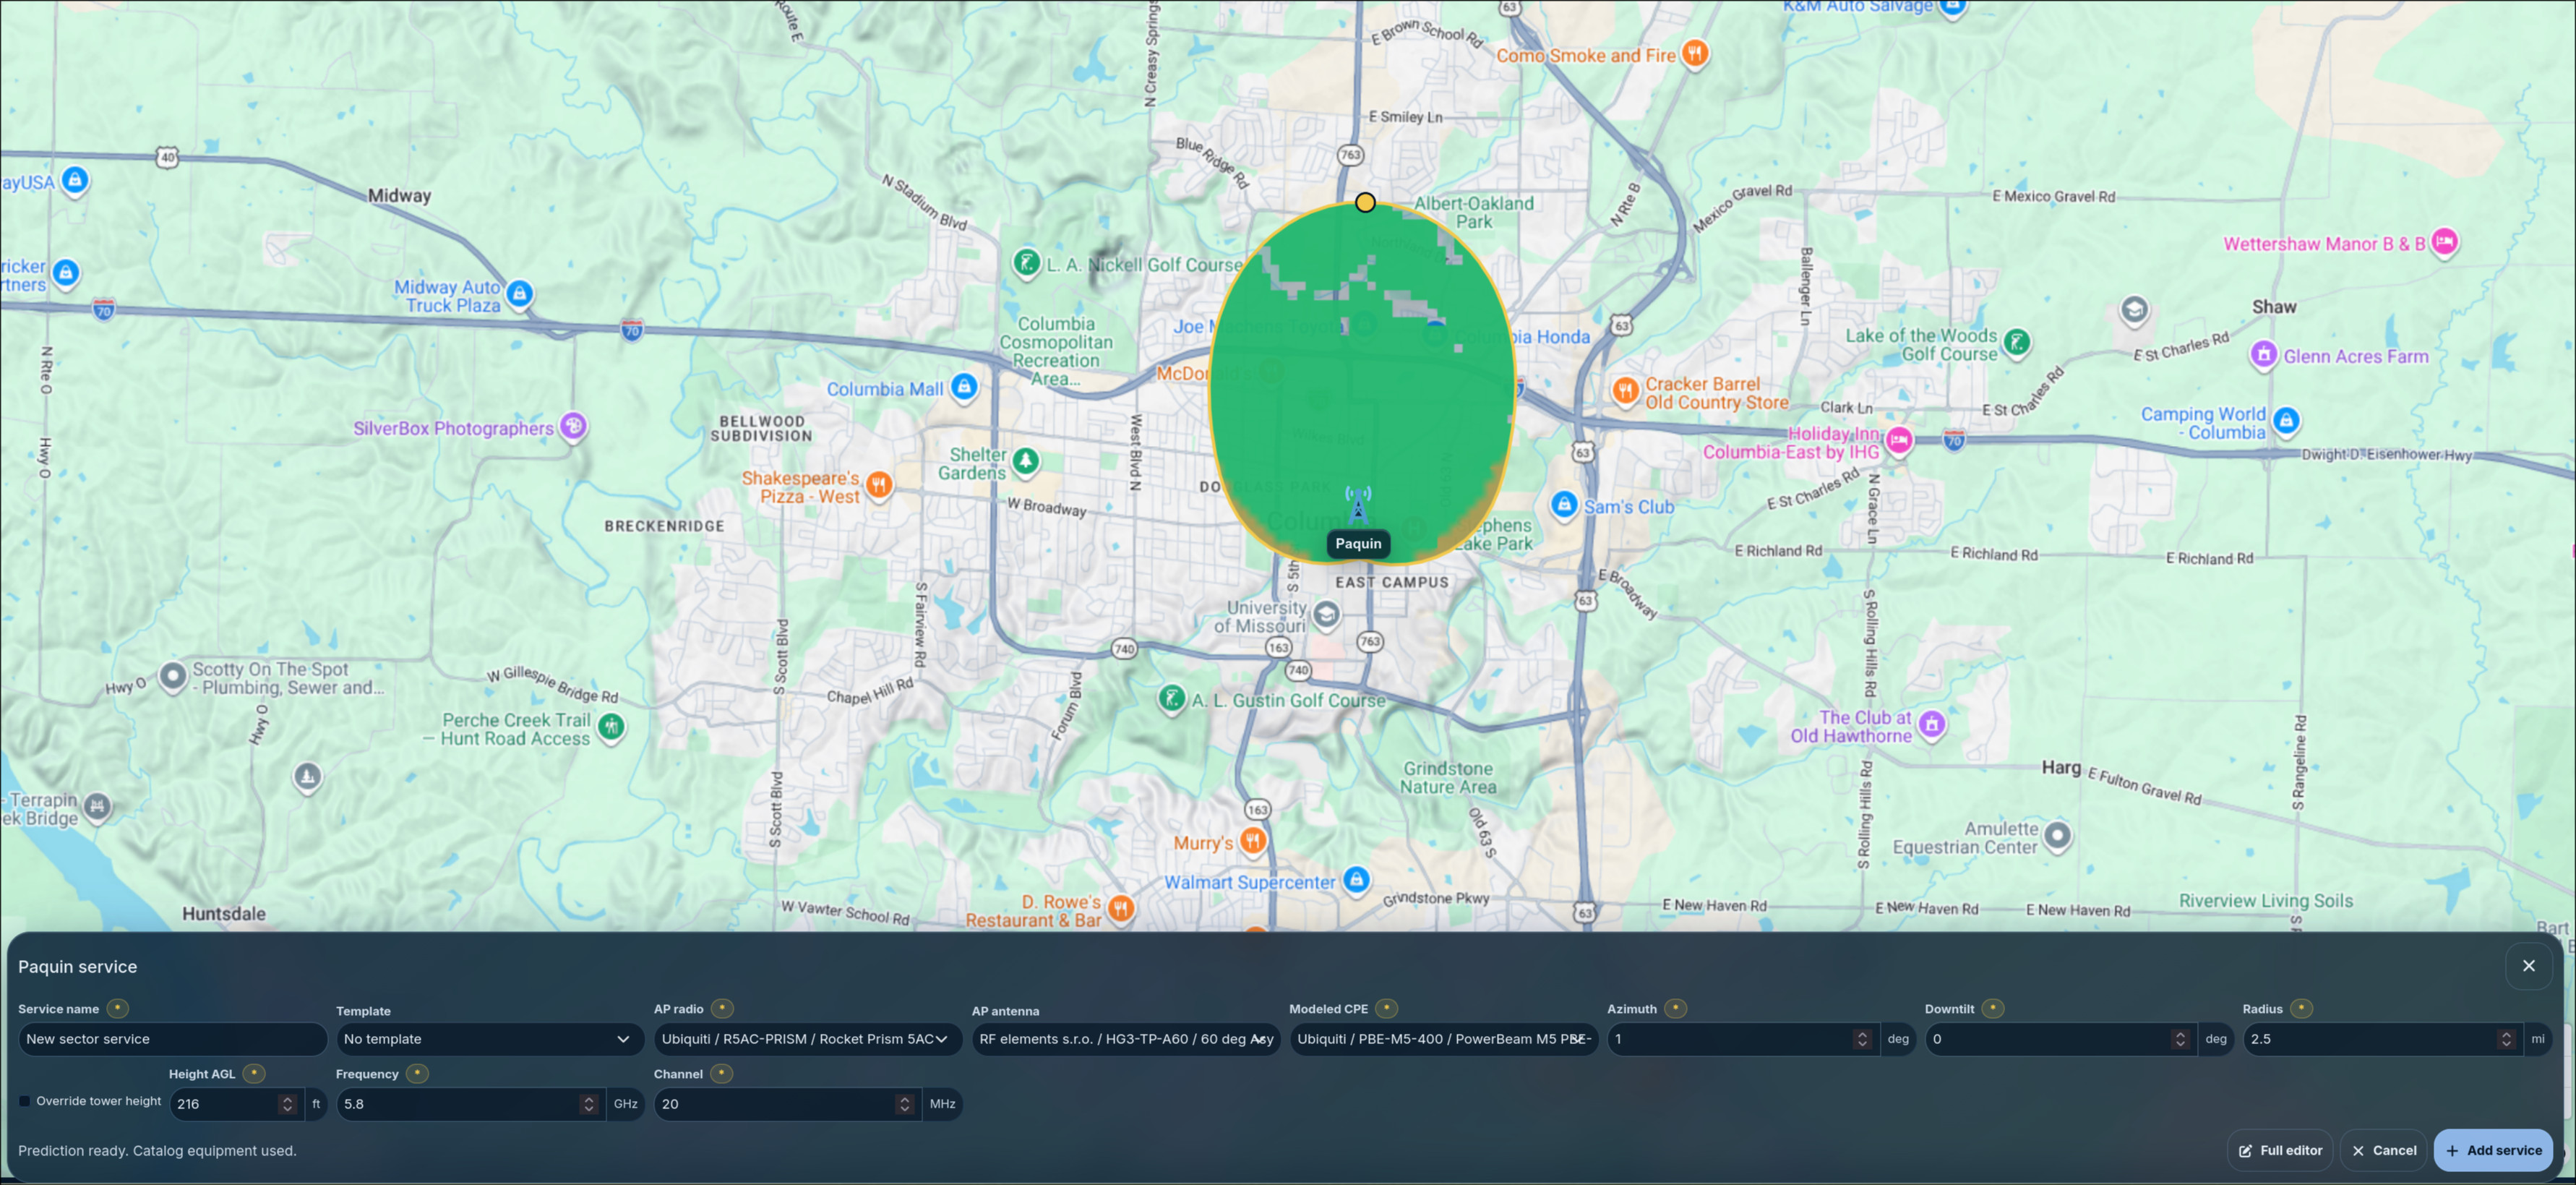
We’ve also made it easy to precisely add radios, and simulate them accurately:
Splat Maps
Everyone can generate a basic signal coverage splat map. We can too:
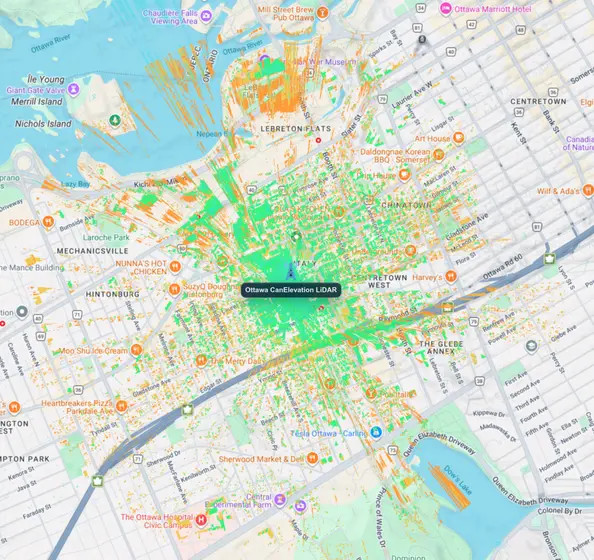
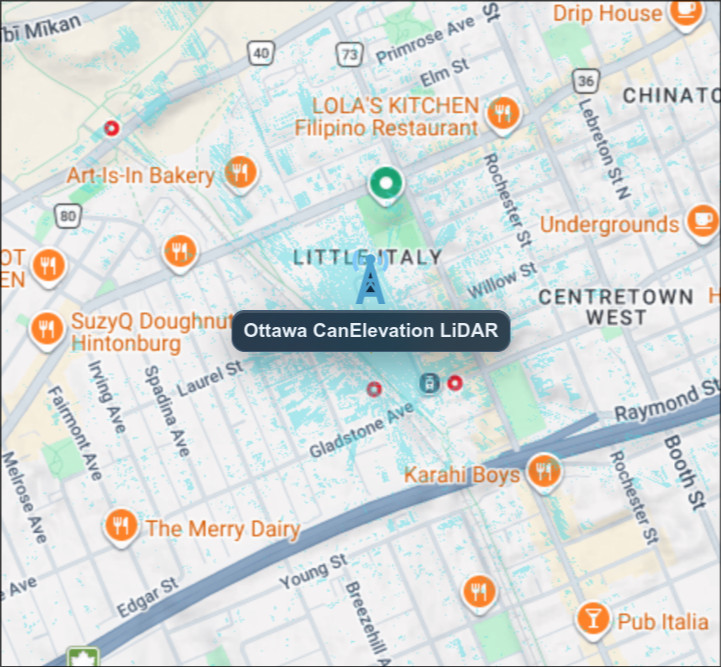
We can do a Line of Sight map, too:
Understanding the Base Data
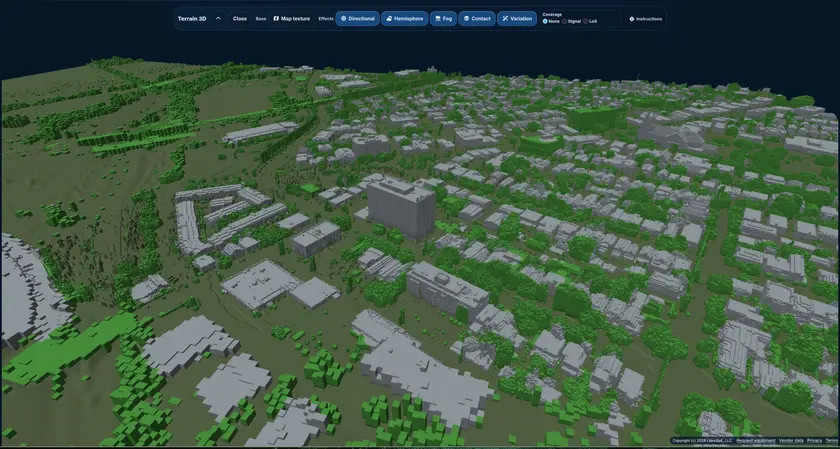
Sometimes, it’s not enough to see “oh, it’s obstructed” - you’d like to see what went wrong. So we included the ability to view 3D areas: your path plot, areas around a tower, and areas you click on are all available in 3D:
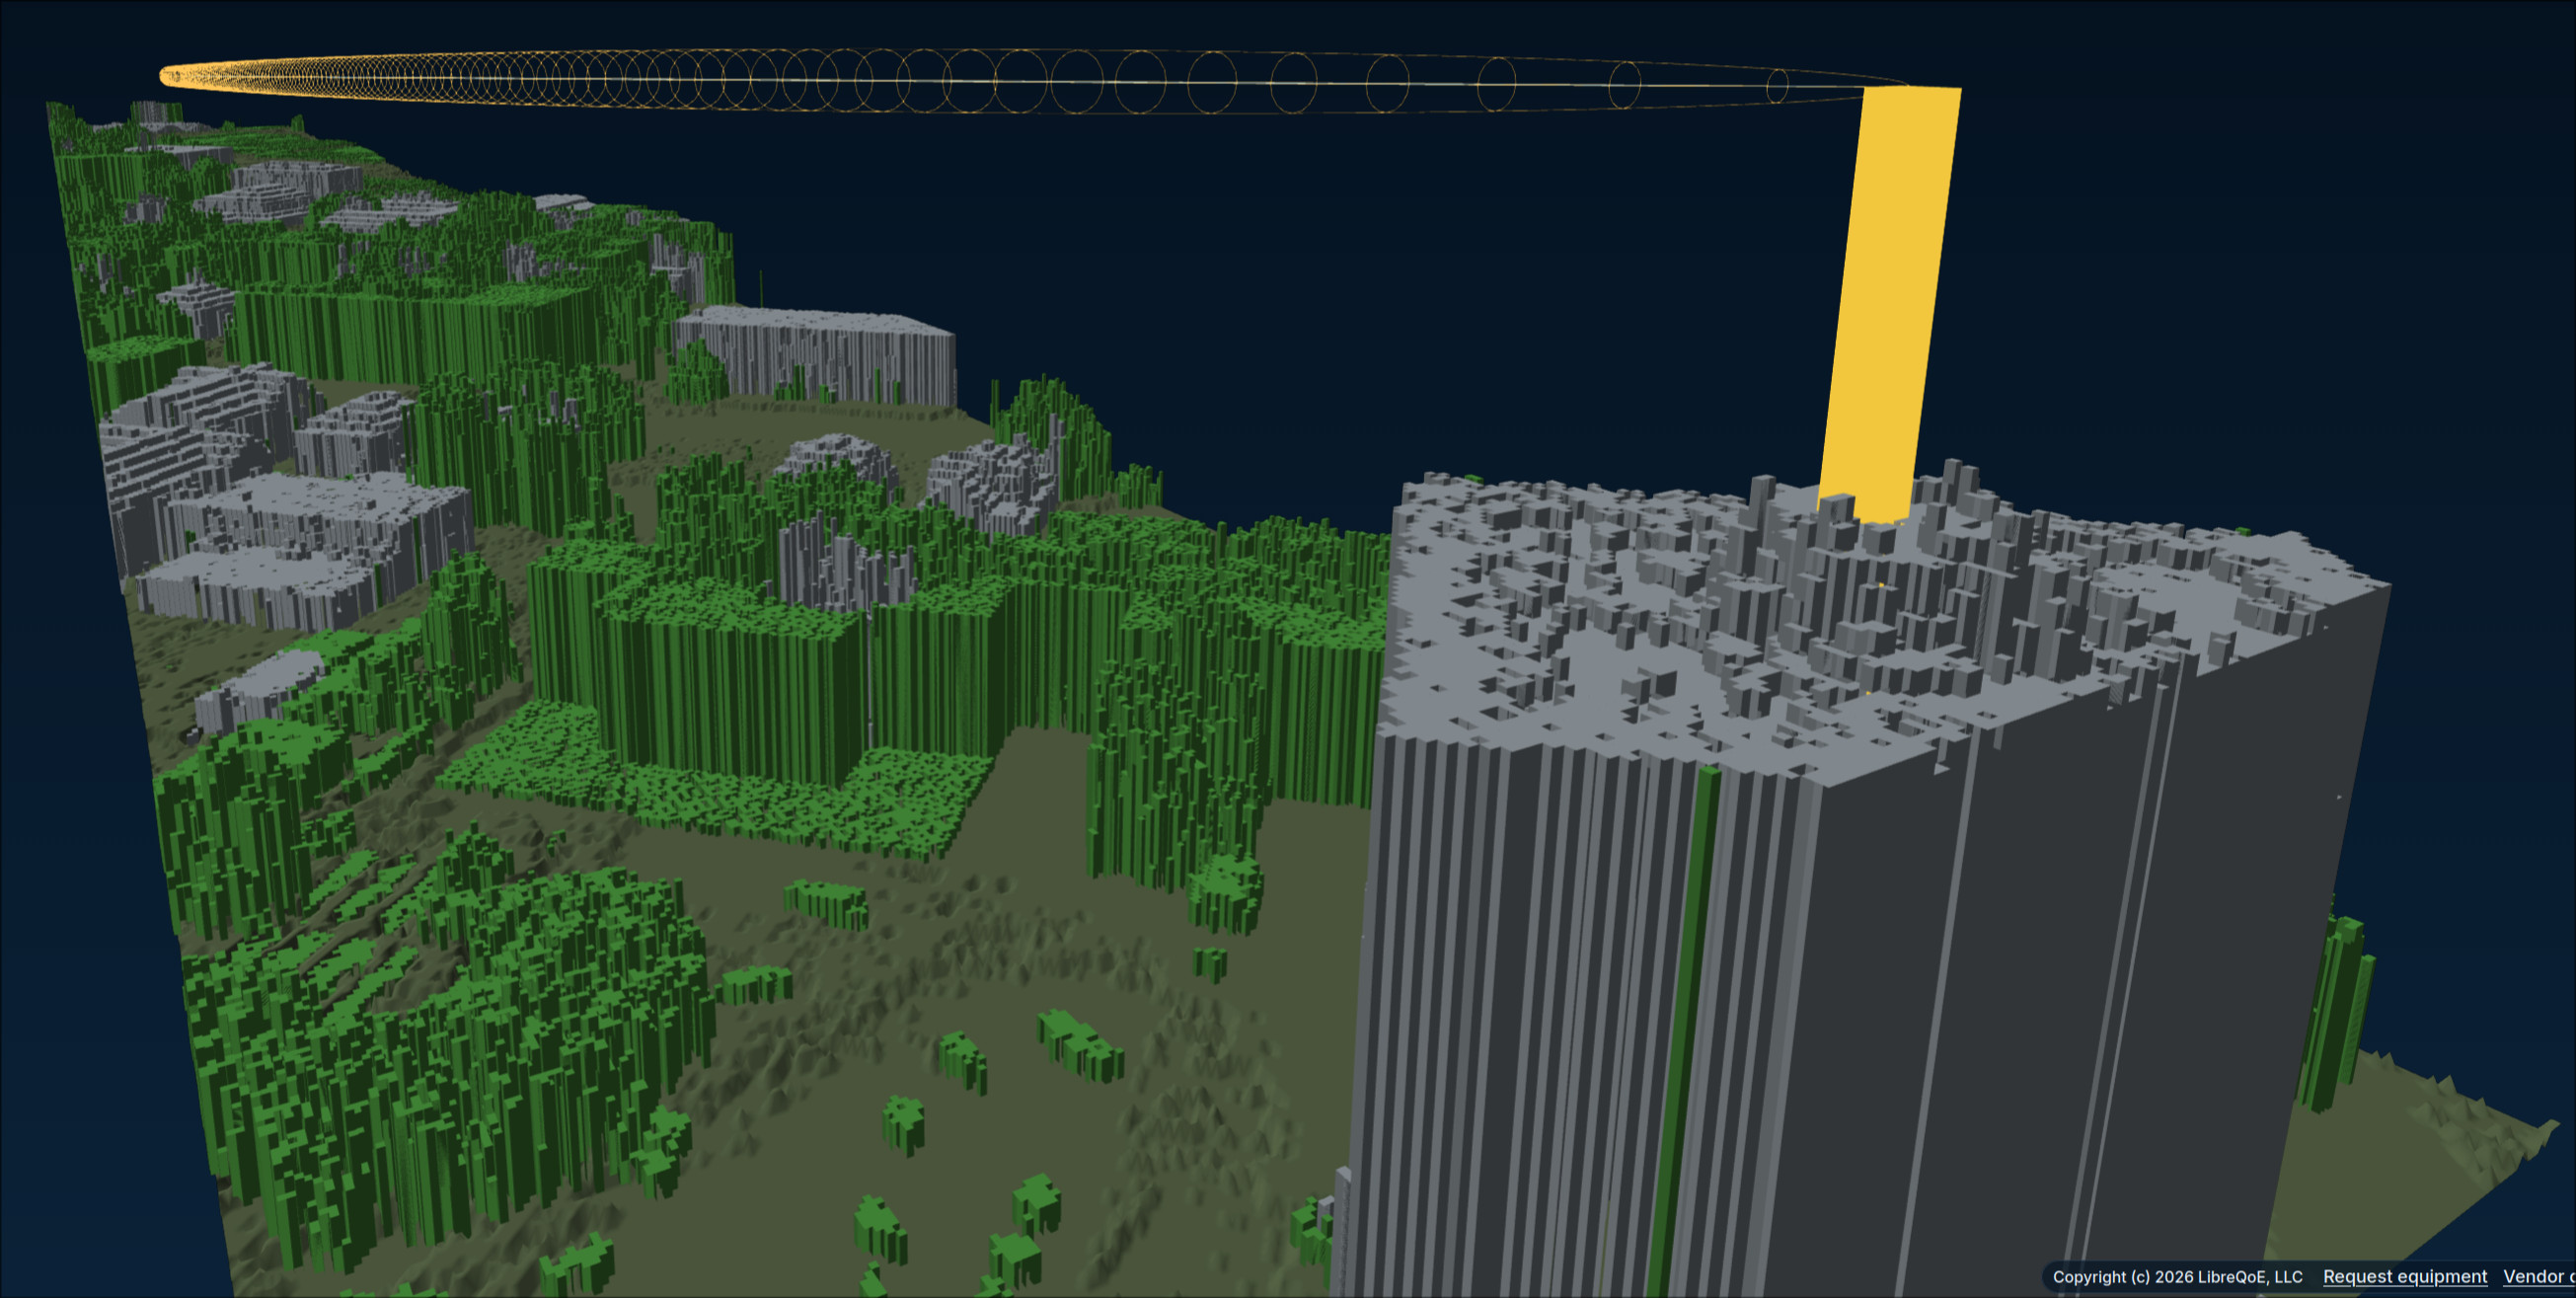
But it really comes together when you add in an RF path:
We weren’t satisfied - so you can also include your coverage overlay in 3D mode:
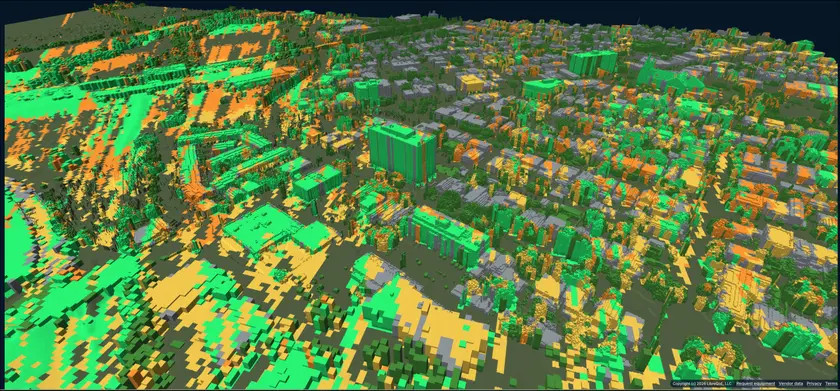
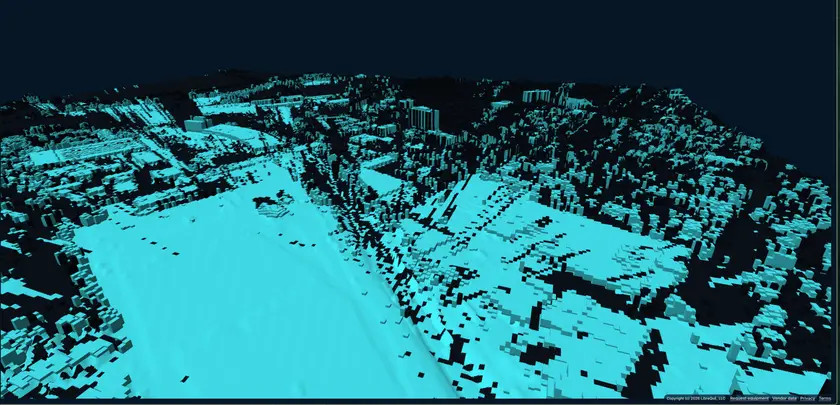
Or your Line-of-Sight in 3D:
Wrap-Up
We’ve had a lot of fun with this, and it’s proving useful day-to-day already. It’s now open for business, and we very much hope that you enjoy it, too.